
[論文レビュー] No Fair Lunch: A Causal Perspective on Dataset Bias in Machine Learning for Medical Imaging
本稿は、医療画像AIにおけるデータセットバイアスを診断および是正するための因果的フレームワークを提示する。本研究では、前処理バイアス、表現バイアス、アノテーションバイアスの3つのバイアスメカニズムを区別し、それぞれに適した是正戦略を要する。公平性の高いモデル開発を支援するための3段階の因果的推論フレームワークを提案し、現在の手法がバイアスの背後にある因果構造を理解せずに適用される場合、しばしば失敗することを示している。
As machine learning methods gain prominence within clinical decision-making, addressing fairness concerns becomes increasingly urgent. Despite considerable work dedicated to detecting and ameliorating algorithmic bias, today's methods are deficient with potentially harmful consequences. Our causal perspective sheds new light on algorithmic bias, highlighting how different sources of dataset bias may appear indistinguishable yet require substantially different mitigation strategies. We introduce three families of causal bias mechanisms stemming from disparities in prevalence, presentation, and annotation. Our causal analysis underscores how current mitigation methods tackle only a narrow and often unrealistic subset of scenarios. We provide a practical three-step framework for reasoning about fairness in medical imaging, supporting the development of safe and equitable AI prediction models.
研究の動機と目的
- 医療画像機械学習モデルにおけるアルゴリズム的バイアスの増大する懸念に応えること。これは、臨床的結果の不平等を引き起こす可能性がある。
- 現在の公平性研究でしばしば混同される、データセットバイアスの異なる因果的メカニズム(前処理、表現、アノテーションの不均衡)を特定および分類すること。
- バイアスの根本的要因に基づいて、適切な公平性是正戦略の選択を支援する、原則的で因果的な推論フレームワークを構築すること。
- 現在のバイアス是正技術が、バイアスの因果構造を理解せずに適用される場合、しばしば効果がなく、場合によっては有害であることを強調すること。
- データ収集およびデータキュレーションプロセスの透明性を高め、公平で均等なAIモデルの設計に因果的仮定を活用するよう促すこと。
提案手法
- 3段階の因果フレームワークを提案:(i) バイアスの因果的性質を特定し、(ii) 各因果経路の倫理的妥当性を評価し、(iii) 適切な是正戦略および指標を選択する。
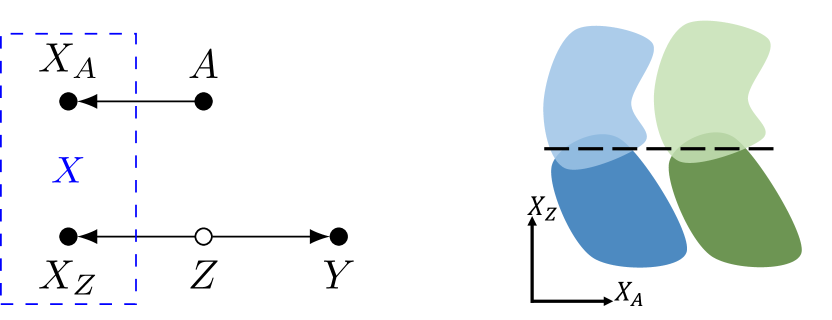
- 因果ダイアグラム(DAGs)を用いて、感受性属性(A)、疾患状態(Z)、画像特徴(X)、ラベル(Y)、選択メカニズム(S)の関係をモデル化する。
- バイアスメカニズムを3つのカテゴリーに分類する:(1) 前処理バイアス(サブグループ間での疾患発生率の不均衡)、(2) 表現バイアス(疾患がサブグループ間で異なる形で現れる)、(3) アノテーションバイアス(サブグループ間でのラベリングの一貫性の欠如)。
- 実験的リスク最小化(ERM)は、表現バイアスに対してのみ適切であり、他のメカニズムには、代表表現のデバイアス化や再ラベリングなどの別アプローチが要請されることを主張する。
- 前処理バイアスに対してはバイアス保持指標を用いることを推奨し、倫理的に正当化される場合には推論時に感受性情報を活用することを検討する。
- バイアスのないデータの収集または生成の重要性を強調し、強い因果仮定のもとで、反事後的生成モデルを用いて公平なデータを合成する手法の有効性を指摘する。

実験結果
リサーチクエスチョン
- RQ1前処理、表現、アノテーションの不均衡という、異なる因果的メカニズムが医療画像データセットにどのように現れ、なぜこれらがしばしば混同されるのか。
- RQ2現在のバイアス是正技術が、さまざまな種類のデータセットバイアスに一般化できないのはなぜか。その制限の背後にある因果的仮定は何か。
- RQ3医療画像データにおけるバイアスの背後にある因果構造に基づいて、公平性是正戦略を選択するにあたり、どのような基準を設けるべきか。
- RQ4因果ダイアグラムは、暗黙の公平性仮定を明示し、AIモデル開発における透明性を向上させるためにどのように活用できるか。
- RQ5合成データ生成およびデバイアス化技術は、医療画像における複合的または複雑なバイアスメカニズムの是正に、どのような役割を果たすか。
主な発見
- 疾患発生率がサブグループ間で異なる前処理バイアスは、ERMのみでは不十分であるため、バイアス保持指標とサブグループごとのパフォーマンス監視を慎重に行う必要がある。
- 疾患がサブグループ間で異なる形で現れる表現バイアスは、その差が生物学的に予想され、倫理的に正当化される場合、ERMが最も適切である。
- ラベリングの一貫性の欠如に起因するアノテーションバイアスは、信頼できる真値がなければ検出・是正が極めて困難であり、再ラベリングや強いバイアス仮定の導入を要することがある。
- 現在の是正手法は、誤ったバイアスメカニズムに適用される場合、しばしば失敗するため、介入の前に因果的診断を行う必要があることが強調される。
- 提案された3段階の因果フレームワークにより、臨床的および倫理的考慮に基づいて、バイアス経路を保存すべきか是正すべきかを体系的に評価できる。
- 能動的なデータ収集および反事後的生成モデルは、因果仮定が明確に定義された場合、バイアスのない学習データを生成する有望な、しかし未だ十分に活用されていない手法である。
より良い研究を、今すぐ始めましょう
論文の読解から最終レビューまで、研究時間を劇的に削減しましょう。
クレジットカード登録不要
このレビューはAIが作成し、人間の編集者が確認しました。