[論文レビュー] Pruning vs Quantization: Which is Better?
この論文は pruning と quantization の比較を広範に行い、量子化が一般に pruning を上回ることを示す。とくに中程度の圧縮でそうした傾向が顕著である。非常に高い圧縮比では prune が役立つ場合がある。
Neural network pruning and quantization techniques are almost as old as neural networks themselves. However, to date only ad-hoc comparisons between the two have been published. In this paper, we set out to answer the question on which is better: neural network quantization or pruning? By answering this question, we hope to inform design decisions made on neural network hardware going forward. We provide an extensive comparison between the two techniques for compressing deep neural networks. First, we give an analytical comparison of expected quantization and pruning error for general data distributions. Then, we provide lower bounds for the per-layer pruning and quantization error in trained networks, and compare these to empirical error after optimization. Finally, we provide an extensive experimental comparison for training 8 large-scale models on 3 tasks. Our results show that in most cases quantization outperforms pruning. Only in some scenarios with very high compression ratio, pruning might be beneficial from an accuracy standpoint.
研究の動機と目的
- ハードウェアのバイアスなしにモデル圧縮の公正な比較を pruning と quantization で促すこと。
- 等圧縮比の下で pruning と quantization から生じる誤差を分析・経験ベースのベンチマークを開発すること。
- 理論境界と実際のネットワークでの per-layer および全モデルの評価を提供すること。
提案手法
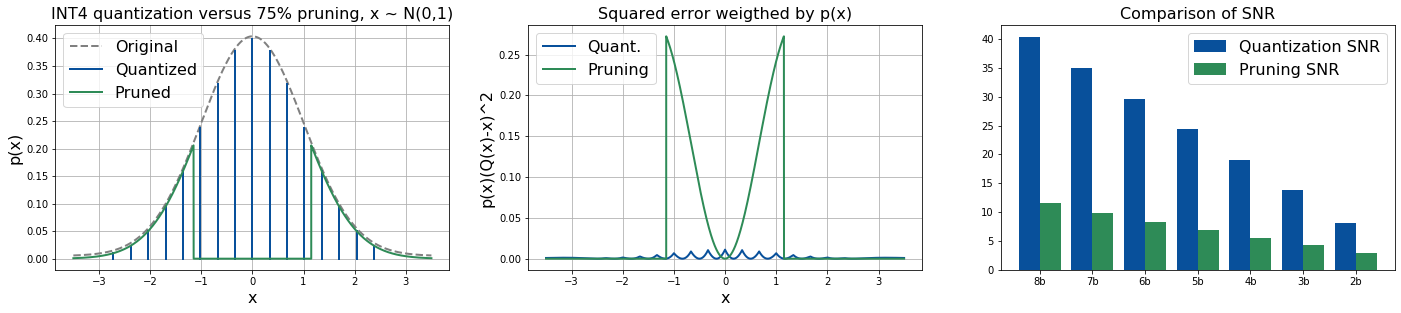
- 対称一様量子化を用いた量子化による重み誤差とその MSE/ SNR の挙動をモデル化すること。
- Magnitude pruning をプルーニング手法として定義し、量子化におけるクリッピングと誤差の類似性を導出すること。
- PTQ のレイヤー出力誤差の下界を求める混合整数二次計画問題を導出すること。
- 希少性マスクを用いた分枝限定法による中程度の次元性に対する正確な pruning 解を提供すること。
- 複数のアーキテクチャで分布、単一レイヤ PTQ、全モデルファインチューニングに渡る大規模な実験を実施すること。
実験結果
リサーチクエスチョン
- RQ1等しい圧縮比の下で、どちらの技術—pruning または quantization—が高い出力精度と低い誤差をもたらすか。
- RQ2データ分布(ガウス分布 vs ヘビーターン分布)は pruning と quantization の相対性能にどのように影響するか。
- RQ3レイヤーごとの量子化および pruning 誤差の厳密な理論境界は何で、経験的結果とどう比較されるか。
- RQ4 pruning または quantization 後のファインチューニングは学習表現を逆転させるか、あるいは維持するか、そしてこれが性能にどう影響するか。
- RQ5ストレージと計算の観点から pruning と quantization の実装ハードウェア影響はどうなるか。
主な発見
| モデル | 元の値 | 量子化 8-bit | 量子化 7-bit | 量子化 6-bit | 量子化 5-bit | 量子化 4-bit | 量子化 3-bit | 量子化 2-bit | プルーニング 8-bit | プルーニング 7-bit | プルーニング 6-bit | プルーニング 5-bit | プルーニング 4-bit | プルーニング 3-bit | プルーニング 2-bit |
|---|---|---|---|---|---|---|---|---|---|---|---|---|---|---|---|
| Resnet-18 | 69.7 | 70.5 | 70.5 | 70.6 | 70.3 | 70.0 | 68.9 | 67.3 | 70.3 | 70.1 | 69.9 | 69.5 | 69.3 | 68.3 | 66.8 |
| Resnet-50 | 76.1 | 76.4 | 76.4 | 76.4 | 76.3 | 76.2 | 75.5 | 72.3 | 76.6 | 76.4 | 76.2 | 76.1 | 75.9 | 75.4 | 74.3 |
| MobileNet-V2 | 71.7 | 71.9 | 72.0 | 71.7 | 71.6 | 70.9 | 68.6 | 59.1 | 68.1 | 65.6 | 61.9 | 56.3 | 48.0 | 34.0 | 21.2 |
| EfficientNet | 75.4 | 75.2 | 75.3 | 75.0 | 74.6 | 74.0 | 71.5 | 60.9 | 72.5 | 70.9 | 68.1 | 63.6 | 56.4 | 44.5 | 27.1 |
| MobileNet-V3 | 67.4 | 67.7 | 67.6 | 67.1 | 66.3 | 64.7 | 60.8 | 50.5 | 65.6 | 64.4 | 62.4 | 60.2 | 56.1 | 31.7 | 0.0 |
| ViT | 81.3 | 81.5 | 81.4 | 81.4 | 81.0 | 80.4 | 78.4 | 72.2 | 76.6 | 76.6 | 76.2 | 73.1 | 72.4 | 71.5 | 69.4 |
| DeepLab-V3 | 72.9 | 72.3 | 72.3 | 72.4 | 71.9 | 70.8 | 63.2 | 17.6 | 65.2 | 62.8 | 56.8 | 47.7 | 32.9 | 18.6 | 10.0 |
| EfficientDet | 40.2 | 39.6 | 39.6 | 39.6 | 39.2 | 37.8 | 33.5 | 15.5 | 34.5 | 33.0 | 30.9 | 27.9 | 24.2 | 17.9 | 8.0 |
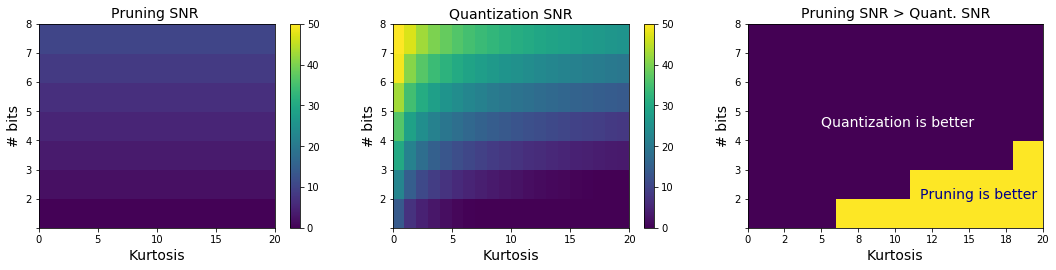
- 中程度の圧縮において、重量分布と実モデルのテンソルに対して、量子化は pruning より一般に高い SNR をもたらす。
- 極めて高い圧縮(おおよそ値あたり 2–3 ビット)および極端なスパース性の下でのみ pruning が量子化に有利となる。
- 46モデルの実モデルテンソル全体で、重量分布の尖度(kurtosis)が pruning が量子化を上回る可能性と関連している;高い尖度は通常量子化を有利にするが、極端な圧縮では別。
- 競合的な QAT と pruning 手法を用いた全モデルファインチューニングにおいて、等圧縮率で量子化対応の訓練(QAT)は通常、Magnitude pruning よりも精度を維持・向上させる。
- 非構造化 pruning は pruning の性能に対する上限を提供する。ハードウェア上の考慮事項は実用的な gains をしばしば削減し、量子化の利点を強化する。
より良い研究を、今すぐ始めましょう
論文設計から論文執筆まで、研究時間を劇的に削減しましょう。
クレジットカード登録不要
このレビューはAIが作成し、人間の編集者が確認しました。