[論文レビュー] Reassessment of the dipole in the distribution of quasars on the sky
本論文はクエーサ密度ディップルを再評価し、大規模な系統的不確実性が大規模な異方性とマスキングから生じ、CMBディップルとの整合性を堅固に排除することを妨げていることを示す。
We investigate recent claims by Secrest et al. of an anomalously large amplitude of the dipole in the distribution of CatWISE-selected quasars on the sky. Two main issues indicate that the systematic uncertainties in the derived quasar-density dipole are underestimated. Firstly, the spatial distribution of the quasars is not a pure dipole, possessing low-order multipoles of comparable size to the dipole. These multipoles are unexpected and presumably caused by unknown systematic effects; we cannot be confident that the dipole amplitude is not also affected by the same systematics until the origin of these fluctuations is understood. Secondly, the 50 percent sky cut associated with the quasar catalogue strongly couples the multipoles, meaning that the power estimate at ell=1 contains significant contributions from ell>1. In particular, the dominant quadrupole mode in the Galactic mask strongly couples the dipole with the octupole, leading to a large uncertainty in the dipole amplitude. Together these issues mean that the dipole in the quasar catalogue has an uncertainty large enough that consistency with the cosmic microwave background (CMB) dipole cannot be ruled out. More generally, current data sets are insufficiently clean to robustly measure the quasar dipole and future studies will require samples that are larger (preferably covering more of the sky) and free of systematic effects to make strong claims regarding their consistency with the CMB dipole.
研究の動機と目的
- クエーサ密度ディップルが潜在的な系統誤差を考慮してCMBディップルと一致するかを評価する。
- クエーサカタログにおける大規模な系統誤差を特定・定量化し、ディップル推定に影響を与え得る要因を特定する。
- マスキングが高次モultipoleをディップルに結合させ、不確実性を過大化させる様子を評価する。
- サブサンプルと代替手法を用いてディップル推定量の頑健性を検証する。
- より大きく清浄なデータセットを用いた将来のクエーサディップル研究の指針を提供する。
提案手法
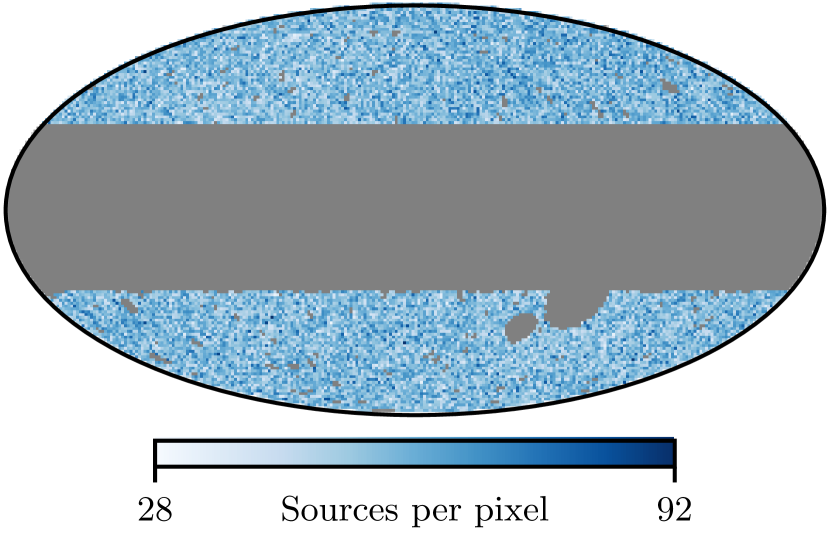
- Secrestらに従ってW1–W2カラーカットと銀河マスキングを用いたCatWISEベースのクエーササンプルを構築し、密度マップを形成する。
- 球面調和回帰を用いたディップル推定への大規模スカイマスクの影響を分析し、結合行列Mを介したモultipole結合を検討する。
- マスク下でのバイアスを研究するために高次モultipoles(四乗子、八乗子)を加えたクエーサマップをシミュレーションする。
- マスクされたマップからディップルと高次モ multipoleを推定するために実空間相関関数法(PolSpice)を使用する。
- クエーサ数の黄道傾斜補正がディップルの解釈に与える影響を調べる。
![Figure 1 : All-sky CMB map from Planck with the monopole subtracted. We specifically show the Public Release 4 data [ 41 ] , employing the Commander component-separation method. A mask covering $22\text{\,}\mathrm{\char 37\relax}$ of the sky has been applied ( $f_{\mathrm{sky}}=$78\text{\,}\mathrm{\](https://ar5iv.labs.arxiv.org/html/2405.09762/assets/x1.png)
実験結果
リサーチクエスチョン
- RQ1系統誤差とマスキングを考慮した場合、クエーサ密度ディップルはCMBディップルと一致するか?
- RQ2大規模な系統誤差と恒星汚染は推定されるディップルの振幅と方向にどのように影響するか?
- RQ3スカイマスキングは高次モ multipoleをディップルに結合させ、結果として不確実性にどのような影響を与えるか?
- RQ4現実的な系統誤差の下で、回帰ベース・相関関数ベースなど異なるディップル推定量の頑健性はどの程度か?
主な発見
- クエーサ密度マップには純粋なディップルを超える大規模構造とモ multipoleが現れており、クリーンなディップル測定に対する信頼性を低下させる。
- マスキングはディップルと高次モ multipole(特に四乗子・八乗子)との間の強い結合を誘発し、ディップルの振幅を偏らせる。
- 明暗分割は恒星汚染がディップルを歪め、CMBディップルとの一致はサンプル選択に依存することを示唆する。
- 高次モ multipoleを含むシミュレーションはディップル推定量にバイアスを生じさせうることを示し、単純な仮定下ではp値が約5σから高次モ multipoleとマスキングを考慮すると約2σへと弱まる。
- PolSpiceの実空間解析はD ≈ 0.010を示すが、統計的・系統的不確実性が大きい。
- 総じて、現在のデータはCMBディップルとの整合性を堅固に確認または否定するには清浄でなく、より大きく清浄なサンプルが必要である。
より良い研究を、今すぐ始めましょう
論文設計から論文執筆まで、研究時間を劇的に削減しましょう。
クレジットカード登録不要
このレビューはAIが作成し、人間の編集者が確認しました。