
[論文レビュー] The first systematically identified repeating partial tidal disruption event
本論文は、制御されたサーベイから系統的に同定された最初の繰り返し部分潮汐破壊現象(pTDE)である、AT 2020vdqを報告する。この源は、初期検出から3年後に明るく急速な光学フレアを示し、広い光学/UV放射(約0.1c)と弱いX線を伴い、新たな電波放射は観測されず、これは境界を持つ恒星残骸が繰り返し軌道を回るpTDEであることを確認する。研究結果は、前身星がおそらくタイトな連星系にあり、Hills機構によって破壊されたものであり、pTDEの発生率が10⁻⁶–10⁻⁵ yr⁻¹ galaxy⁻¹であると制限され、これは数パーセントの核内連星率を示唆している。
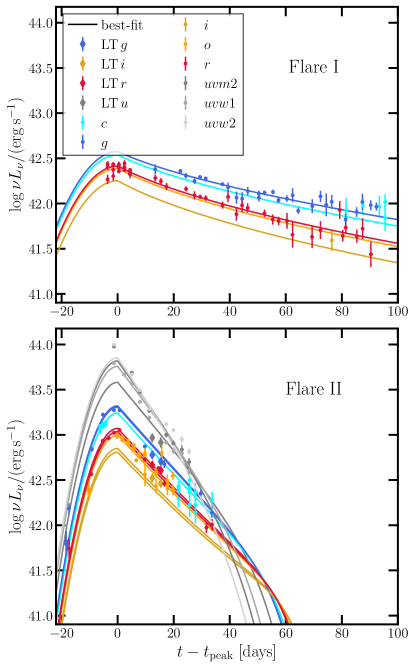
Tidal disruption events (TDEs) occur when a star enters the tidal radius of a supermassive black hole (SMBH). If the star only grazes the tidal radius, a fraction of the stellar mass will be accreted in a partial TDE (pTDE). The remainder can continue orbiting and may re-disrupted at pericenter, causing a repeating pTDE. pTDEs may be as or more common than full TDEs (fTDEs), yet few are known. In this work, we present the discovery of the first repeating pTDE from a systematically-selected sample, AT\,2020vdq. AT\,2020vdq was originally identified as an optically- and radio-flaring TDE. Around $3$ years after its discovery, it rebrightened dramatically and rapidly in the optical. The optical flare was remarkably fast and luminous compared to previous TDEs. It was accompanied by extremely broad (${\sim}0.1c$) optical/UV spectral features and faint X-ray emission ($L_X \sim 3 imes10^{41}$\,erg\,s$^{-1}$), but no new radio-emitting component. Based on the transient optical/UV spectral features and the broadband light curve, we show that AT\,2020vdq is a repeating pTDE. We then use it to constrain TDE models; in particular, we favor a star originally in a very tight binary system that is tidally broken apart by the Hills mechanism. We also constrain the repeating pTDE rate to be $10^{-6}$ to $10^{-5}$ yr$^{-1}$ galaxy$^{-1}$, with uncertainties dominated by the unknown distribution of pTDE repeat timescales. In the Hills framework, this means the binary fraction in the galactic nucleus is of the order few percent.
研究の動機と目的
- 制御されたサーベイから系統的に同定された最初の繰り返し部分潮汐破壊現象(pTDE)を特定・特徴づけること。
- AT 2020vdqにおける第二の光学フレアの物理的起源を、pTDEと超新星などの代替的瞬間的現象の間で区別すること。
- 観測された繰り返し時間スケールを用いて、pTDE発生率を制限し、銀河核におけるタイトな連星の割合を推定すること。
- 複数のフレアにわたるスペクトルおよび光曲線の進化を分析することで、降着ダイナミクスと円盤形成を含め、TDEモデルを検証すること。
提案手法
- 光学的および電波的フレアを示す瞬間的現象の系統的サーベイを実施し、TDE候補(AT 2020vdqを含む)を同定した。
- 複数のエポックからの多波長光曲線(光学、UV、X線、電波)および分光的データを分析し、フレアの再発およびスペクトル進化を検出した。
- 速度幅(約0.1c)および線形プロファイル(例:広帯域He II、N III)を用いて、高速流およびTDEに一致する降着ダイナミクスを推定した。
- X線および電波の上限(例:Swift/XRTおよびVLA)を適用し、フレア後の新たな降着またはジェット活動を除外した。
- SNIDを用いてフレア再発後のスペクトルをモデル化し、Ia型超新星の汚染をテストした。その結果、ピークから30日後のIa型超新星モデルと87%の一致が得られた。
- 33個の銀河のサンプルにおいて、TDEと超新星の同時発生確率を計算し、第二のフレアがpTDEであるか、超新星であるかの有意性を評価した。
実験結果
リサーチクエスチョン
- RQ1AT 2020vdqは真の繰り返し部分潮汐破壊現象であるか。その再発を裏付ける証拠は何か。
- RQ2AT 2020vdqにおける第二の明るく急速に変化する光学フレアを説明する物理的メカニズムは何か。
- RQ3第二のフレアがIa型超新星である可能性はあり得るか。そのような偶然の一致はどれほどあり得るか。
- RQ4観測された繰り返し時間スケールおよびフレアの性質は、銀河核における連星率にどのような制限を課すか。
- RQ5スペクトル的特徴(例:広帯域線、N III)およびX線/電波の上限は、現在のTDEモデルの妥当性をどのように示唆するか。
主な発見
- AT 2020vdqは、系統的に同定された最初の繰り返し部分潮汐破壊現象であり、初期検出から約3年後に第二の光学フレアが観測されたことで確認された。
- 第二のフレアは非常に明るく急速に変化し、既知のTDEよりも冷却した黒体温度を示し、極めて広い光学/UV放射(約0.1c)を示した。
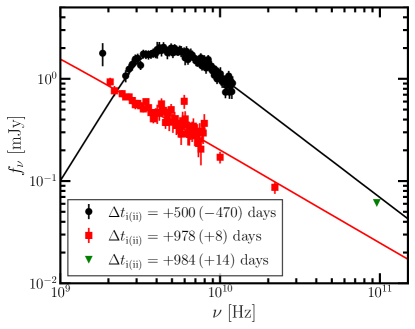
- X線放射は弱く(L_X ~ 3×10⁴¹ erg s⁻¹)、新たな電波放射は検出されず、新たなジェットまたは降着円盤形成を除外した。
- 分光解析により、TDEでは以前に観測されなかった5000 Åおよび5500 Å付近の広帯域特徴が検出されたが、これらはpTDE起源と一致し、標準的な超新星とは異なる。
- フレア再発後のスペクトルは、ピークから約30日後のIa型超新星モデルに最もよく合致した(87%一致)。しかし、狭帯域線の欠如およびフレアのタイミングは、pTDE解釈を支持する。
- pTDE発生率は10⁻⁶–10⁻⁵ yr⁻¹ galaxy⁻¹に制限され、これは数パーセントの核内連星率を示唆しており、連星星の潮汐破壊のHills機構と整合的である。
より良い研究を、今すぐ始めましょう
論文の読解から最終レビューまで、研究時間を劇的に削減しましょう。
クレジットカード登録不要
このレビューはAIが作成し、人間の編集者が確認しました。