[論文レビュー] The Great Wave: Evidence of a large-scale vertical corrugation propagating outwards in the Galactic disc
この論文は若い星サンプル(巨星とCepheid)を用いて銀河のワープを地図化し、ワープの外側に広がる円盤内で大規模な垂直の波状起伏を明らかにしている。振幅150–200 pcの起伏が約10 kpcにわたり、外向きの垂直運動と伝播する波形を見出す。
We analyse the three-dimensional structure and kinematics of two samples of young stars in the Galactic disc, containing respectively young giants ($\sim$17$\, $000 stars out to heliocentric distances of $\sim$7 kpc) and classical Cepheids ($\sim$3400 stars out to heliocentric distances of $\sim$15 kpc). The vertical structure of the two samples exhibit a consistent shape of the Milky Way's warp, whose amplitude reaches $\sim$700 pc at a Galactocentric radius R $\sim$ 14 kpc. Moreover, both samples show evidence of a large-scale vertical corrugation on top of the warp with a vertical height of $\sim$150-200 pc, extending over a large portion of the Galactic disc between Galactocentric radii $R \sim$ 10-12 kpc in the third Galactic quadrant (galactic longitudes $180^\circ < l < 270^\circ$) and $\sim$12-14 kpc in the second Galactic quadrant ($90^\circ < l < 180^\circ$). Its total length is at least 10 kpc and can possibly reach $\sim$ 20 kpc with the Cepheid sample. The stars in the corrugation exhibit both radial and vertical systematic motions, with Galactocentric radial velocities towards the outer disc of about 10-15 km/s. In the vertical motions, once the warp signature is subtracted, the residuals show a large-scale feature of systematically positive vertical velocities, which is shifted to slightly larger Galactocentric radii with respect to the spatial vertical corrugation (with a phase difference of roughly $π/2$), indicating an oscillatory behaviour. A comparison of the observed shift with a simple toy model suggests that the corrugation can be interpreted as a wave propagating towards the outer disc. The wave mapped in this work is located at larger heliocentric distances compared to the Radcliffe wave, a $\sim$2.7 kpc filament of dense gas clouds close to the Sun, and exhibits a larger coverage of the Galactic disc.
研究の動機と目的
- 若い星サンプル2つ(巨星とCepheid)を用いて銀河円盤の三次元構造と運動学を特徴づける。
- ワープを地図化し、外側の円盤でワープの上に重なる追加の垂直的撹乱を探す。
- 垂直起伏の振幅、半径方向の広がり、運動学的特徴を定量化する。
- ワープ推定後の残差が伝播する垂直波を示すかを評価する。
- 独立なトレーサー間でワープの結果を比較し頑健性を検証する。
提案手法
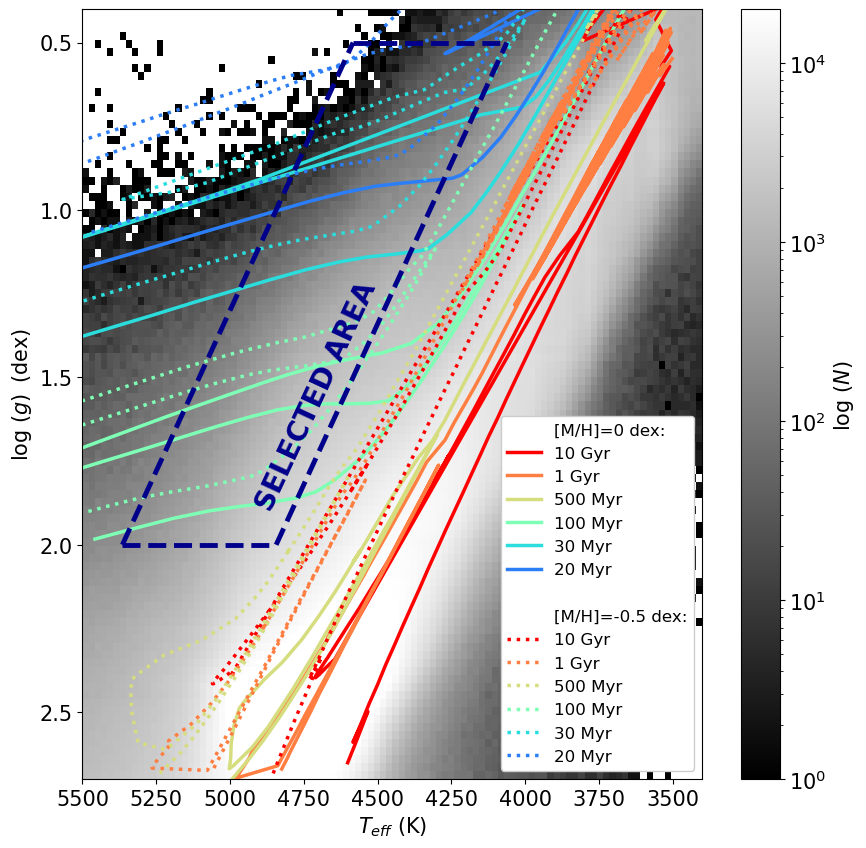
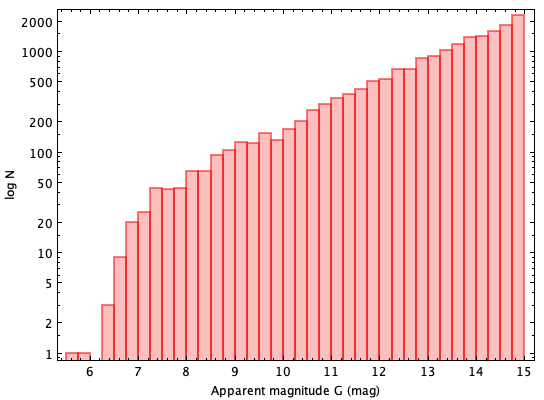
- Gaia DR3 および補助データから2つの若い星サンプルを選択:約16,000人の若い巨星と約3,400人の古典的Cepheid。
- 惑星? distances via Bayesian distances with a disc-based prior and a selection-function-corrected luminosity function.
- m=1 の傾斜リングアプローチと振幅 h_w(R) およびノード線 phi_LON(R) を用いたグローバルなパラメトリックフィットでワープをモデル化。
- Z_w(R,phi)=h_w(R) sin(phi - phi_LON(R)) をワープ予測として計算し、観測された Z と比較してワープパラメータを導出。
- ワープモデリング後の残差を検査して非ワープ構造を同定し、半径方向の起伏特徴を明らかにする。
- 両方のサンプルで結果を検証し、系統誤差(円盤厚さ、消失、選択)について議論する。
実験結果
リサーチクエスチョン
- RQ1若い星を用いて追跡した既知のワープを超える銀河円盤の大規模な垂直構造は何か?
- RQ2単純な m=1 ワープで垂直分布を適切に説明できるのか、それとも残差の起伏が存在するのか?
- RQ3若い巨星と Cepheid が追跡する銀河ワープの振幅、半径依存性、位相は何か?
- RQ4ワープ差し引き後の残差は外側円盤で伝播する垂直波を示すか?
- RQ5独立した若い星トレーサー(巨星 vs Cepheid)間でワープの測定はどれくらい一貫しているか?
主な発見
- 若い巨星と Cepheid の両方が垂直高が 150–200 pc、半径方向の幅が ~3 kpc、長さは少なくとも 10 kpc(Cepheid では潜在的に 20 kpc) のワープを示す。
- ワープの振幅は銀河中心からの半径とともに増加し、位相角は R ≈ 11–12 kpc 附近で変化が見られ、ノード線がより大きな半径へと徐々にねじれる。
- 半径方向速度は outer disc に向けて ~10–15 km/s の内向き/外向きの運動を V_R で示す。
- ワープを引いた後の残差は、一貫した大規模垂直起伏(特徴1)を明らかにし、方位角方向に約10 kpc、振幅約150–200 pc、地図の端に対称の可能性がある特徴2を示す。
- この起伏パターンは、銀河円盤の外側へ伝播する垂直波と一致しており、最大位相はほぼ変位ゼロ線に沿っている。
より良い研究を、今すぐ始めましょう
論文設計から論文執筆まで、研究時間を劇的に削減しましょう。
クレジットカード登録不要
このレビューはAIが作成し、人間の編集者が確認しました。