[論文レビュー] The GTC exoplanet transit spectroscopy survey I: OSIRIS transmission spectroscopy of the short period planet WASP-43b
本研究では、GTC/OSIRIS機器を用いた長スリット分光法を用い、超短周期系外惑星WASP-43bが主星を通過する際の波長依存の食深度を測定することで、大気の組成を分析した。惑星の大気中にナトリウム吸収が2.9σの有意性で検出された可能性を報告し、軌道周期を精緻化した結果、軌道の崩壊の兆候が示唆された。
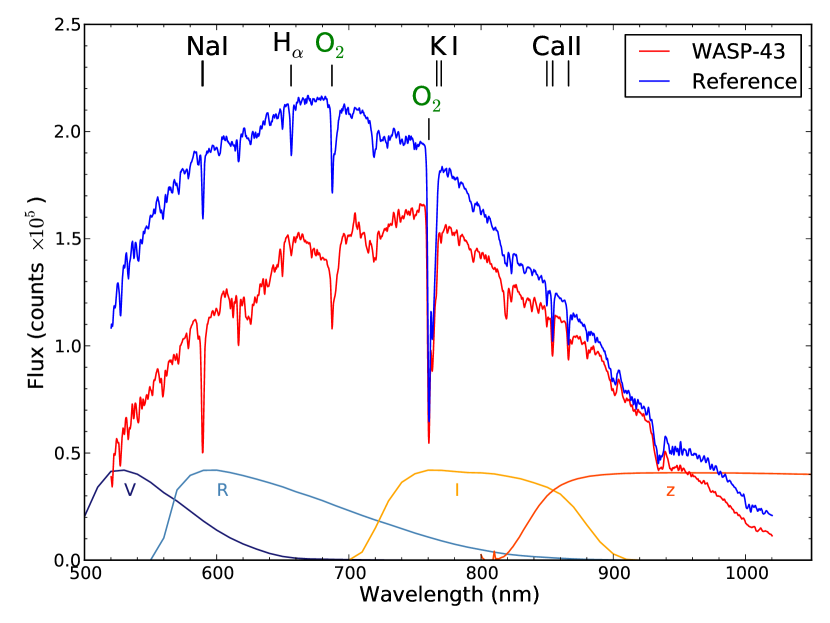
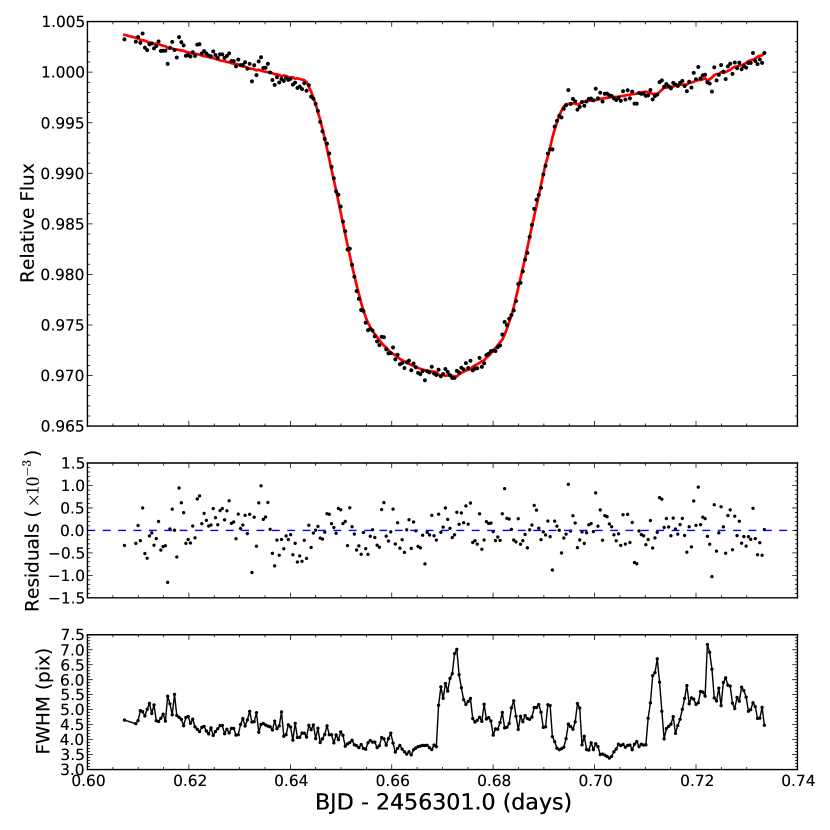
We used GTC instrument OSIRIS to obtain long-slit spectra in the optical range (520-1040 nm) of the planetary host star WASP-43 (and a reference star) during a full primary transit event and four partial transit observations. We integrated the stellar flux of both stars in different wavelength regions producing several light curves. We fitted transit models to these curves to measure the star-to-planet radius ratio, Rp/Rs, across wavelength among other physical parameters. We measure a Rp/Rs in the white light curve of 0.15988^{+0.00133}_{-0.00145}. We present a tentative detection of an excess in the planet-to-star radius ratio around the Na I doublet (588.9 nm, 589.5 nm) when compared to the nearby continuum at the 2.9-sigma level. We find no significant excess of the measured planet-to-star radius ratio around the K I doublet (766.5 nm, 769.9 nm) when compared to the nearby continuum. Combining our observations with previous published epochs, we refine the estimation of the orbital period. Using a linear ephemeris, we obtained a period of P=0.81347385 +/- 1.5 x 10^{-7} days. Using a quadratic ephemeris, we obtained a period of 0.81347688 +/- 8.6 x 10^{-7} days, and a change in this parameter of dP/dt = -0.15 +/- 0.06 sec/year. As previous results, this hints to the orbital decay of this planet although a timing analysis over several years needs to be made in order to confirm this.
研究の動機と目的
- 地上の長スリット分光法を用いて、WASP-43bの透過スペクトルにおける大気吸収特徴を検出すること。
- 新規およびアーカイブ済みの食時系列データを統合することで、WASP-43bの軌道周期の精度を向上させること。
- 光学領域(520–1040 nm)におけるナトリウムおよびカリウムの可能性のある大気スペクトル特徴を調査すること。
- 長期間にわたる食時系列の変動を用いて、WASP-43bにおける軌道の崩壊の有無を評価すること。
- 長スリット分光法が、軌道移動中の系外惑星のマルチカラー光度測定および透過分光法に有効であるかを検証すること。
提案手法
- GTC/OSIRIS機器を用い、5回の食イベント(1回の完全食、4回の部分食)中にWASP-43と参照星の長スリット分光を取得した。
- 波長領域ごとの星の放射束を統合し、白色光および狭帯域の光曲線を作成し、食深度の分析に用いた。
- マークフ・チェイン・モンテカルロ(MCMC)法を用いて光曲線に食モデルをフィットさせ、Rₚ/Rₛおよびその不確実性を導出した。
- 線形および2次式の予報式を用いて食時系列残差をモデル化し、軌道周期およびその時間変化率(Ṗ)を推定した。
- Na I二重線(588.9, 589.5 nm)およびK I二重線(766.5, 769.9 nm)を中心とした狭帯域フィルタと、近隣の連続スペクトル領域における惑星対星半径比(Rₚ/Rₛ)を比較した。
- 幅広いフィルタ(25, 18, 10 nm)を用いて、波長依存の食深度の変化を評価し、大気吸収特徴の探索を行った。
実験結果
リサーチクエスチョン
- RQ1WASP-43bの光学透過スペクトルに、検出可能な大気吸収特徴が存在するか?
- RQ2観測された食時系列データは、WASP-43bの軌道の崩壊を支持するか?
- RQ3統合された食観測に基づく、WASP-43bの精緻化された軌道周期は何か?
- RQ4ナトリウムおよびカリウムの特徴は透過スペクトルに存在するか?また、モデル予測と比較するとどうなるか?
- RQ5長スリット分光法は、軌道移動中の系外惑星のマルチカラー光度測定および透過スペクトルを効果的に取得できるか?
主な発見
- Na I二重線(588.9, 589.5 nm)付近で、2.9σの有意な過剰(Δ(Rₚ/Rₛ) = (2.18 ± 0.74) × 10⁻³)が検出され、大気中にナトリウム吸収が存在する可能性が示唆された。
- K I二重線(766.5, 769.9 nm)では有意な過剰は検出されず、光学領域におけるカリウム吸収が弱いか、存在しない可能性を示唆した。
- 白色光曲線から得られた平均Rₚ/Rₛ = 0.15988⁺⁰.⁰⁰¹³³₋₀.⁰⁰¹⁴⁵は、以前の測定と整合的であった。
- 線形予報式を用いた場合、軌道周期はP = 0.81347385 ± 1.5 × 10⁻⁷日に精緻化された。
- 2次式予報式を用いた場合、軌道周期はP = 0.81347688 ± 8.6 × 10⁻⁷日であり、周期変化率Ṗ = -0.15 ± 0.06 秒/年であった。これは、軌道の崩壊の兆候を示唆した。
- 600〜720 nmでRₚ/Rₛが増加し、720〜880 nmで減少する傾向は、惑星の明るさ温度(約1684 K)におけるVOおよびTiO吸収を含む大気モデルと整合的であった。
より良い研究を、今すぐ始めましょう
論文設計から論文執筆まで、研究時間を劇的に削減しましょう。
クレジットカード登録不要
このレビューはAIが作成し、人間の編集者が確認しました。