
[論文レビュー] TwinExplainer: Explaining Predictions of an Automotive Digital Twin
TwinExplainerは、深層学習駆動の自動車デジタルツインの予測を解釈可能にする3段階の説明可能AIフレームワークを導入する。SHAPに基づく特徴量の寄与度を用いて、正常または異常なシステム動作に最も影響を与えるセンサーチャネルを特定する。力のプロットなどの可視化を通じてグローバルおよびローカルの説明を生成することで、信頼性を高め、車両保守における意思決定を支援する。
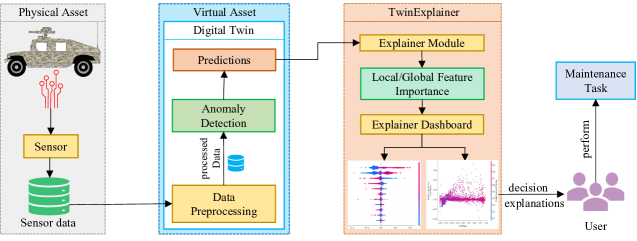
Vehicles are complex Cyber Physical Systems (CPS) that operate in a variety of environments, and the likelihood of failure of one or more subsystems, such as the engine, transmission, brakes, and fuel, can result in unscheduled downtime and incur high maintenance or repair costs. In order to prevent these issues, it is crucial to continuously monitor the health of various subsystems and identify abnormal sensor channel behavior. Data-driven Digital Twin (DT) systems are capable of such a task. Current DT technologies utilize various Deep Learning (DL) techniques that are constrained by the lack of justification or explanation for their predictions. This inability of these opaque systems can influence decision-making and raises user trust concerns. This paper presents a solution to this issue, where the TwinExplainer system, with its three-layered architectural pipeline, explains the predictions of an automotive DT. Such a system can assist automotive stakeholders in understanding the global scale of the sensor channels and how they contribute towards generic DT predictions. TwinExplainer can also visualize explanations for both normal and abnormal local predictions computed by the DT.
研究の動機と目的
- 深層学習に基づく自動車デジタルツインにおける解釈不能性の欠如に取り組み、特に重要な保守応用分野におけるユーザーの信頼性と採用を妨げる要因を解消すること。
- 自動車のような複雑なサイバーフィジカルシステムにおけるデジタルツインで使用される最新の深層学習モデルのブラックボックス性を克服すること。
- 整備士、運用者、エンジニアなどの自動車関係者が、なぜデジタルツインが特定のセンサーチャネルを正常または異常と予測したのかを理解できるようにすること。
- リアルタイムの車両診断に適した、データ処理、デジタルツイン推論、説明生成を統合したシステマティックなパイプラインを開発すること。
- 特徴量の重要度とSHAP値を用いて、グローバル(システム全体)およびローカル(インスタンス固有)のモデル予測の説明を提供すること。
提案手法
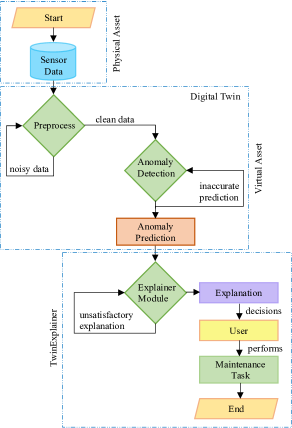
- 3段階のアーキテクチャパイプラインを活用する:(1) VeProデータセットからの時系列センサーデータのインジェストおよび前処理、(2) 異常検出のための深層学習分類器としての時空間畳み込みネットワーク(TCN)の訓練、(3) SHapley Additive exPlanations(SHAP)を用いた説明生成。
- SHAPを適用して特徴量の寄与度を計算し、エンジン温度、燃料消費率などの各センサーチャネルがモデル出力に与える寄与度を定量化する。
- 個々の予測における各特徴量の正負の影響を可視化する力のプロットを用いてローカル説明を生成し、色分けされた矢印で影響の方向と大きさを示す。
- 要約プロットと従属プロットを用いてグローバル説明を生成し、全データセット全体における特徴量の重要度とトレンドを可視化する。
- 力のプロットにおいて、トレーニングセット全体の平均予測値(ベース値)を基準点として用い、個々の予測の文脈を明確にする。
- 正常および異常予測を併記して可視化し、特徴量の寄与度の違いを比較することで、システム健全性の重要な指標を特定する。
実験結果
リサーチクエスチョン
- RQ1非技術的ステークホルダー(整備士、運用者など)が、深層学習に基づく自動車デジタルツインの予測をどのように解釈できるようにできるか。
- RQ2どのセンサーチャネルがデジタルツインのシステム状態を正常または異常と分類する意思決定に最も顕著に寄与しているか。
- RQ3SHAPに基づく特徴量の寄与度は、車両デジタルツインにおいてローカル(インスタンス固有)およびグローバル(システム全体)の両方の予測を効果的に説明できるか。
- RQ4実世界の車両データセットにおいて、正常状態と異常状態の間で特徴量の寄与度にどのような違いが生じるか。
- RQ5視覚的説明は予測保守におけるユーザーの信頼性と意思決定をどの程度向上させるか。
主な発見
- 正常予測(スコア0.63)の力のプロットでは、TrOutShaftSp、EngCoolantTemp、FuelRate、AccelPedalPos、TransOilTemp、VehSpeedEngが予測に最も肯定的な影響を与えていた。
- 同じ正常予測において、InjCtlPres、PctEngLoad、TrSelGr、TransConvLockUpEngaged、BoostPres、IntManTempなどの特徴量が結果に否定的な寄与度を示していた。
- 異常予測(スコア0.63)においても、TrOutShaftSpが最も肯定的な影響を持つ特徴量であったが、TransOilTempとEngCoolantTempが最も否定的な影響を及ぼしていた。
- 正常予測においてはInjCtlPresが最も否定的な寄与度を持つ特徴量であったのに対し、異常状態ではTransOilTempが最も悪影響を及ぼす特徴量として特定された。
- 可視化により、正常状態と異常状態における特徴量の重要度に明確な違いが示され、ステークホルダーが重要な故障の兆候を特定できるようになった。
- フレームワークはSHAPを用いてグローバルおよびローカルの両方の説明を効果的に生成した。特に力のプロットは、特徴量の効果の方向と大きさを明確に伝えるのに成功した。
より良い研究を、今すぐ始めましょう
論文の読解から最終レビューまで、研究時間を劇的に削減しましょう。
クレジットカード登録不要
このレビューはAIが作成し、人間の編集者が確認しました。