[論文レビュー] Very high resolution canopy height maps from RGB imagery using self-supervised vision transformer and convolutional decoder trained on Aerial Lidar
要約:この論文は、RGB Maxar イメージから非常に高解像度の樹冠高マップを生成する自己教師付き視覚トランスフォーマーエンコーダと密ベースのデコーダを提示し、GEDI に基づく全球スケーリングで精練、NEON、CA-Brande、São Paulo の航空 LiDAR と比較して評価します。
Vegetation structure mapping is critical for understanding the global carbon cycle and monitoring nature-based approaches to climate adaptation and mitigation. Repeated measurements of these data allow for the observation of deforestation or degradation of existing forests, natural forest regeneration, and the implementation of sustainable agricultural practices like agroforestry. Assessments of tree canopy height and crown projected area at a high spatial resolution are also important for monitoring carbon fluxes and assessing tree-based land uses, since forest structures can be highly spatially heterogeneous, especially in agroforestry systems. Very high resolution satellite imagery (less than one meter (1m) Ground Sample Distance) makes it possible to extract information at the tree level while allowing monitoring at a very large scale. This paper presents the first high-resolution canopy height map concurrently produced for multiple sub-national jurisdictions. Specifically, we produce very high resolution canopy height maps for the states of California and Sao Paulo, a significant improvement in resolution over the ten meter (10m) resolution of previous Sentinel / GEDI based worldwide maps of canopy height. The maps are generated by the extraction of features from a self-supervised model trained on Maxar imagery from 2017 to 2020, and the training of a dense prediction decoder against aerial lidar maps. We also introduce a post-processing step using a convolutional network trained on GEDI observations. We evaluate the proposed maps with set-aside validation lidar data as well as by comparing with other remotely sensed maps and field-collected data, and find our model produces an average Mean Absolute Error (MAE) of 2.8 meters and Mean Error (ME) of 0.6 meters.
研究の動機と目的
- 非常に高解像度の植生構造マッピングを動機づけ、炭素循環評価と FLR 監視を支援する。
- Global Maxar RGB イメージ上で訓練された自己教師付きエンコーダを開発し、普遍的な植生特徴を抽出する。
- 密ベースのデコーダを航空 LiDAR(1 m CHM)上に訓練し、ピクセルごとの樹冠高を予測する。
- GEDI ベースのグローバル補正を用いて予測を洗練し、サイト間一般化を改善する。
- California と São Paulo の高解像度 CHM を提供し、LiDAR および既存の CHM と評価する。
提案手法
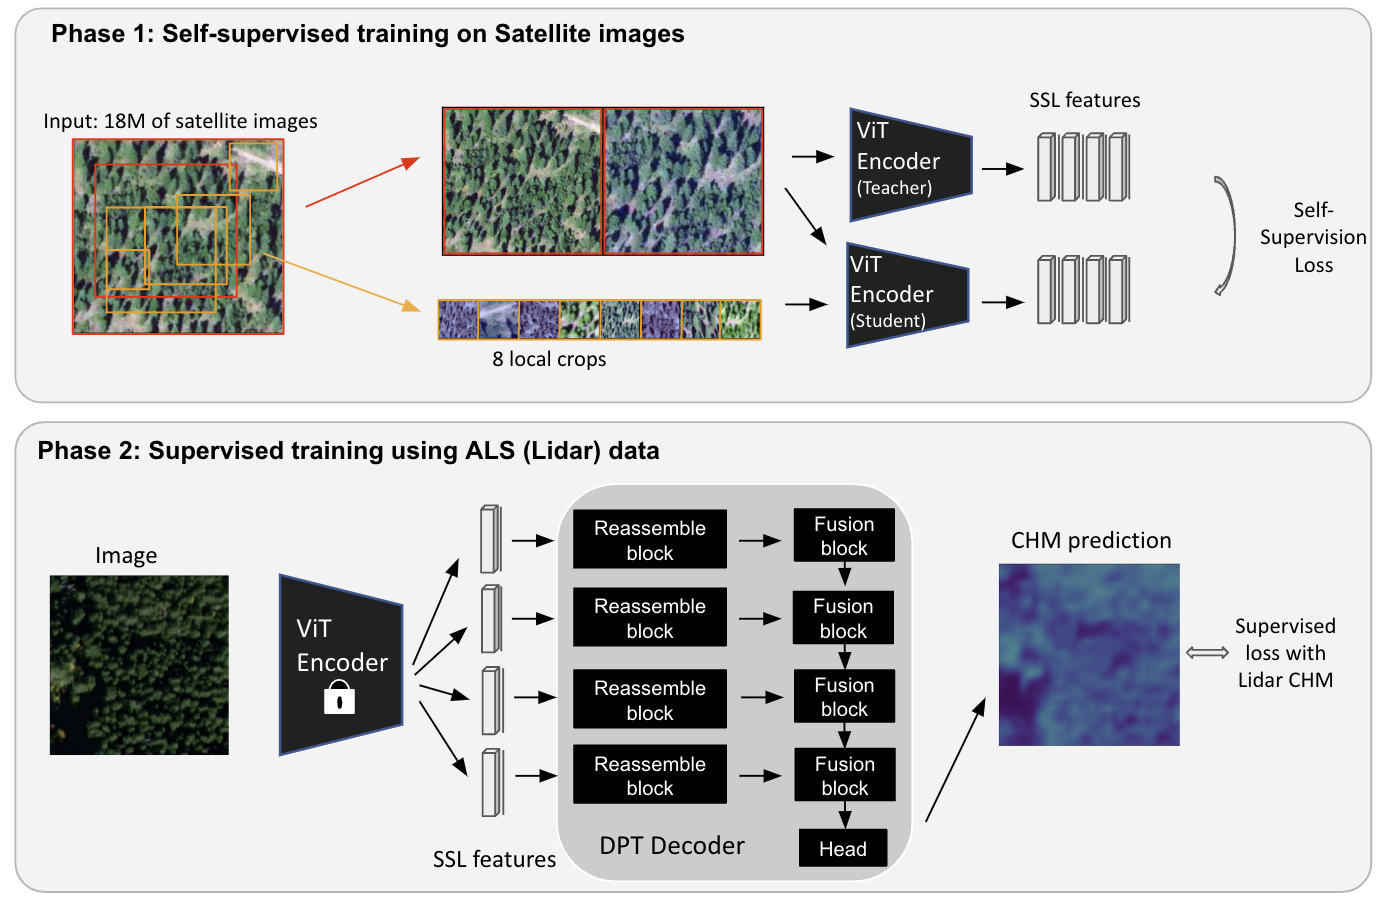
- 18 百万の 256x256 Maxar RGB サムネイル上で訓練された大規模な自己教師付き ViT エンコーダを使用する(SSL フェーズ)。
- SSL 特徴の上に Dense Prediction Transformer (DPT) デコーダを訓練し、高解像度 CHM を予測する(フェーズ 2)。
- 樹冠高回帰のための Sigloss ベースの目的と、トレーニングを安定させるビニング/分類出力を適用する。
- グローバル補正のために GEDI ベースの畳み込みネットワークを 128x128 RGB パッチ上で訓練し、GEDI RH95 を予測する。
- 推論時(後処理)に ALS 基準の予測を再スケールするために GEDI 予測 CHM から得られる密な補正係数 gamma(x) を算出する。
- ResUNet ベースラインおよび既存の CHM マップと比較し、NEON、CA-Brande、São Paulo データセットで検証する。
実験結果
リサーチクエスチョン
- RQ1高解像度 RGB イメージからの自己教師付き特徴は、多様なバイオーム間で正確な樹冠高推定に一般化できるか?
- RQ2SSL エンコーダと密なトランスフォーマー Decorder を組み合わせると、既存手法より高解像度の CHM を生み出せるか?
- RQ3GEDI ベースの再スケーリング補正は、ALS由来の CHM の跨サイト精度と一般化を改善するか?
- RQ4提案手法の定量的精度(MAE, RMSE, R^2, ME)は NEON、CA-Brande、São Paulo のテストセットでどの程度か?
- RQ5提案された高解像度 CHM は、約 10 m–30 m 解像度の既存の全球マップと比較してどうか?
主な発見
| モデル | データセット | MAE (m) | RMSE (m) | R^2 (ブロック) | ME (m) |
|---|---|---|---|---|---|
| SSL | NEON test | 2.6 | 4.4 | 0.70 | -1.4 |
| SSL | São Paulo | 2.8 | 4.0 | 0.63 | -1.5 |
| SSL | CA-Brande | 1.4 | 0.74 | 0.60 | -0.6 |
| SSL+GEDI | NEON test | 2.7 | 4.5 | 0.69 | -1.5 |
| SSL+GEDI | São Paulo | 5.1 | 7.3 | 0.41 | -0.5 |
| SSL+GEDI | CA-Brande | 2.0 | 0.0 | 0.63 | -0.1 |
- SSL ベースのモデル(18M Maxar 画像で訓練)と DPT デコーダは、NEON および CA-Brande データセットに対する ResUNet ベースラインより樹冠高推定精度を改善する。
- São Paulo では GEDI 補正ステップ(SSL+GEDI)が最良の結果を提供し、全球 GEDI 監督による一般化が向上することを示唆。
- 表2 は樹冠高指標を示し、SSL+GEDI は MAE 2.8 m、RMSE 4.5 m、R^2 0.63、ME 1.5 m をデータセット全体で平均的に達成し、いくつかのケースで ResUNet ベースラインを上回る。
- 以前の全球 CHM(Lang ら 2022a; Potapov ら 2021)と比較して、生成したマップは解像度が高く(入力約 0.59 m GSD、出力 1 m CHM)、検証 LiDAR での精度も競合的である。
- 著者らは高解像度データセットをクラウド最適化 GeoTIFF として AWS OpenData および Earth Engine で公開し、公開アクセスを提供している。
- このアプローチは California および São Paulo の壁から壁へ CHMs を実用的に示し、より細かな炭素マッピングと FLR 監視を可能にする。

より良い研究を、今すぐ始めましょう
論文設計から論文執筆まで、研究時間を劇的に削減しましょう。
クレジットカード登録不要
このレビューはAIが作成し、人間の編集者が確認しました。