[論文レビュー] Visual CoT: Advancing Multi-Modal Language Models with a Comprehensive Dataset and Benchmark for Chain-of-Thought Reasoning
Visual CoT は Visual Chain-of-Thought パイプラインと 373k 件のビジュアル CoT データセットを導入し、マルチターンで領域に焦点を当てた推論を可能にする multimodal LLM の解釈性と性能を向上させる。 また、ベンチマークと事前学習済みの VisCoT モデルを提供する。
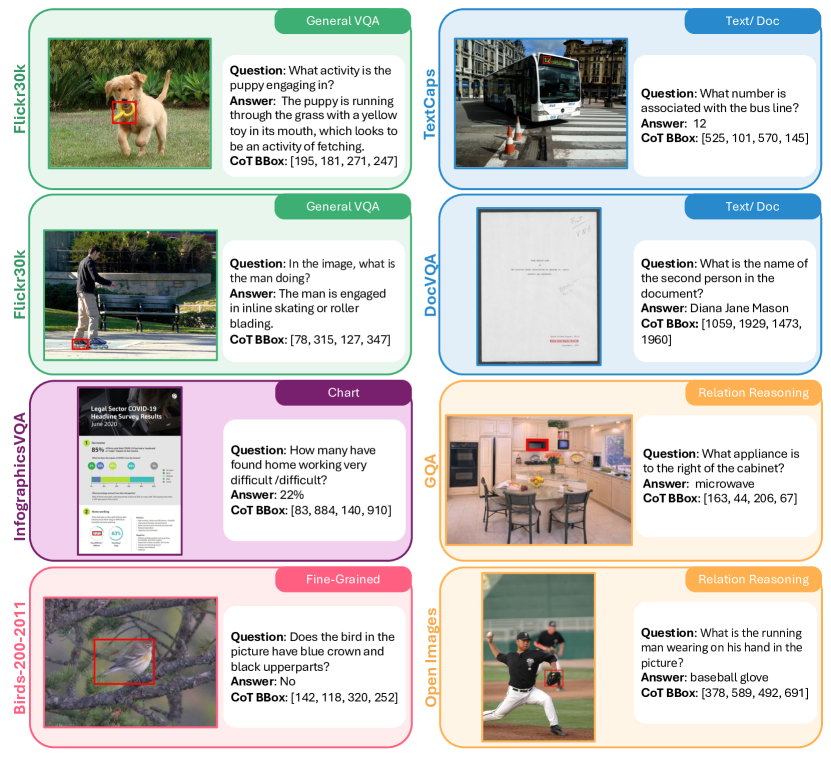
Multi-Modal Large Language Models (MLLMs) have demonstrated impressive performance in various VQA tasks. However, they often lack interpretability and struggle with complex visual inputs, especially when the resolution of the input image is high or when the interested region that could provide key information for answering the question is small. To address these challenges, we collect and introduce the large-scale Visual CoT dataset comprising 438k question-answer pairs, annotated with intermediate bounding boxes highlighting key regions essential for answering the questions. Additionally, about 98k pairs of them are annotated with detailed reasoning steps. Importantly, we propose a multi-turn processing pipeline that dynamically focuses on visual inputs and provides interpretable thoughts. We also introduce the related benchmark to evaluate the MLLMs in scenarios requiring specific local region identification. Extensive experiments demonstrate the effectiveness of our framework and shed light on better inference strategies. The Visual CoT dataset, benchmark, and pre-trained models are available on https://hao-shao.com/projects/viscot.html to support further research in this area.
研究の動機と目的
- VQA および関連タスクにおける中間的な視覚 Chain-of-Thought の監視不足を解消する。
- 重要な画像領域を特定し、動的で多ターンの視覚推論を可能にする。
- 領域固有の推論を評価するための拡張可能な Visual CoT データセットとベンチマークを提供する。
提案手法
- グローバルな画像領域と局所化された領域を同時に使用する2ターンのマルチモーダル・パイプライン(VisCoT)を提案する。
- 質問に答える際に重要な領域をハイライトする境界ボックス付きの373kQAペアを含む Visual CoT データセットを作成する。
- 初期のキャプションベースの事前学習と、視覚 CoT データでの微調整という2段階プロセスで VisCoT を訓練する。
- 局所領域に焦点を当て、領域について推論するタスクで ML LMs を評価する Visual CoT ベンチマークを導入する。
- 視覚サンプラーを用いて局所領域をクロップ・処理し、グローバルな画像特徴と統合して MLLM に組み込む。
実験結果
リサーチクエスチョン
- RQ1視覚 CoT データは領域に焦点を当てた視覚推論タスクにおける MLLM の解釈性と精度を向上させるか。
- RQ2動的な領域焦点処理は VQA、読み物/インフォグラフィック、リレーション推論データセットでの性能にどのように影響するか。
- RQ3境界ボックスの品質とサンプリング戦略が Visual CoT の有効性に与える影響は何か。
主な発見
- VisCoT は Visual CoT ベンチマークで性能を向上させ、特にドキュメント/テキストおよび高解像度の視覚タスクで顕著な改善を示す。
- 視覚 CoT を用いると、CoT なしのベースラインと比較して SROIE で最大 8× の性能向上を得られる。
- 視覚 CoT パイプラインは、画像解像度が低く、視覚トークンが少ない場合でも効果的である。
- 真の境界ボックス(GT)は上限を提供し、性能を大幅に向上させることから、 bbox の正確さが重要であることを示している。
- アブレーションにより、拡張されたコンテクストクロッピングと局所化された画像の後に元の質問を再確認する prompting が精度を向上させることが示される。
- VisCoT は複数のベンチマークでいくつかの SoTA 手法と比較して良好な性能を示し、タスク間の汎化を示している。

より良い研究を、今すぐ始めましょう
論文設計から論文執筆まで、研究時間を劇的に削減しましょう。
クレジットカード登録不要
このレビューはAIが作成し、人間の編集者が確認しました。