[論文レビュー] Zooming Out on Zooming In: Advancing Super-Resolution for Remote Sensing
この論文は、リモートセンシング超解像の知覚指標としてCLIPScoreを提案し、Large-scale S2-NAIPデータセットを構築し、GANs・拡散・CNNベースの手法を比較し、CLIPScoreを用いてGAN(ESRGAN)が他を上回る一方、超解像出力は機械用途にはまだ効果が小さいことを示すとともに、グローバルモデルを訓練・公開データとコードを提供する。
Super-Resolution for remote sensing has the potential for huge impact on planet monitoring by producing accurate and realistic high resolution imagery on a frequent basis and a global scale. Despite a lot of attention, several inconsistencies and challenges have prevented it from being deployed in practice. These include the lack of effective metrics, fragmented and relatively small-scale datasets for training, insufficient comparisons across a suite of methods, and unclear evidence for the use of super-resolution outputs for machine consumption. This work presents a new metric for super-resolution, CLIPScore, that corresponds far better with human judgments than previous metrics on an extensive study. We use CLIPScore to evaluate four standard methods on a new large-scale dataset, S2-NAIP, and three existing benchmark datasets, and find that generative adversarial networks easily outperform more traditional L2 loss-based models and are more semantically accurate than modern diffusion models. We also find that using CLIPScore as an auxiliary loss can speed up the training of GANs by 18x and lead to improved outputs, resulting in an effective model in diverse geographies across the world which we will release publicly. The dataset, pre-trained model weights, and code are available at https://github.com/allenai/satlas-super-resolution/.
研究の動機と目的
- リモートセンシング超解像出力と人間の判断を一致させる指標を確立する。
- スケーラブルな訓練・評価を可能にする大規模な公開データセット(S2-NAIP)を作成する。
- 複数のリモートセンシングデータセットでSR手法(CNN、GAN、拡散)を体系的に比較する。
- 超解像出力の下流機械タスクへの有用性と人間主導の可視化の比較を評価する。
- 上述の知見を活用して、グローバルに適用可能な超解像モデルを開発・公開する。
提案手法
- SR品質の人間判断と相関するCLIPScoreを提案する。
- Sentinel-2とNAIP画像のLR-HRペアを合計120万組で含むS2-NAIPデータセットを構築・公開する。
- 4つのデータセットにおいてSR手法(SRCNN、HighResNet、ESRGAN、SR3)をベンチマークし、CLIPScoreとLPIPS/cPSNRで知覚品質を評価する。
- SR出力または特徴量が下流タスクを改善するかを調査し、SR表現を用いた転移学習を分析する。
- トレーニングを加速し出力を改善するCLIPScoreベースの補助損失をESRGANに追加する。
実験結果
リサーチクエスチョン
- RQ1CLIPScoreはリモートセンシングSR出力の人間判断とどの程度相関するか。
- RQ2データセット規模(S2-NAIP)がSR性能に与える影響はどの程度か。
- RQ3どのSR手法ファミリ(CNN、GAN、拡散)がリモートセンシングデータで最も知覚品質に優れるか。
- RQ4SR出力は下流の機械タスクに有益か、それとも主に人間の可視化用途か。
- RQ5CLIPベースの補助損失とドメイン知識でSR訓練を改善してより良い結果を得られるか。
主な発見
| Method | S2-NAIP cPSNR | S2-NAIP LPIPS | S2-NAIP CLIP | WorldStrat cPSNR | WorldStrat LPIPS | WorldStrat CLIP | PROBA-V cPSNR | PROBA-V LPIPS | PROBA-V CLIP | OLI2MSI cPSNR | OLI2MSI LPIPS | OLI2MSI CLIP |
|---|---|---|---|---|---|---|---|---|---|---|---|---|
| SRCNN | 17.9039 | 0.3517 | 0.7 | 31.5746 | 0.4493 | 0.6196 | 23.9455 | 0.2112 | 0.7924 | 43.4113 | 0.7614 | 0.9285 |
| HighResNet | 20.9171 | 0.199 | 0.6705 | 32.8787 | 0.4416 | 0.5998 | 22.5687 | 0.2137 | 0.8096 | 35.7374 | 0.86 | 0.94 |
| ESRGAN | 22.6506 | 0.8406 | 0.8745 | 31.723 | 0.8299 | 0.9842 | 24.9336 | 0.2154 | 0.8465 | 36.3202 | 0.8709 | 0.9518 |
| SR3 | 19.4706 | 0.6292 | 0.8223 | 30.545 | 0.7745 | 0.9232 | 23.7789 | 0.2115 | 0.8115 | 34.2208 | 0.839 | 0.9391 |
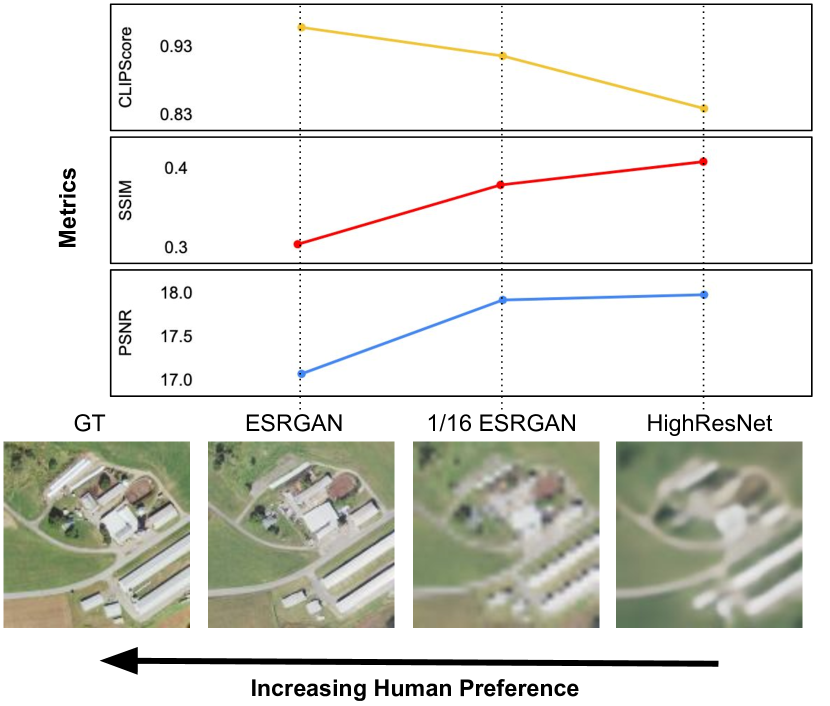
- リモートセンシングにおけるSRではPSNRとSSIMが人間の判断と十分に相関しない。
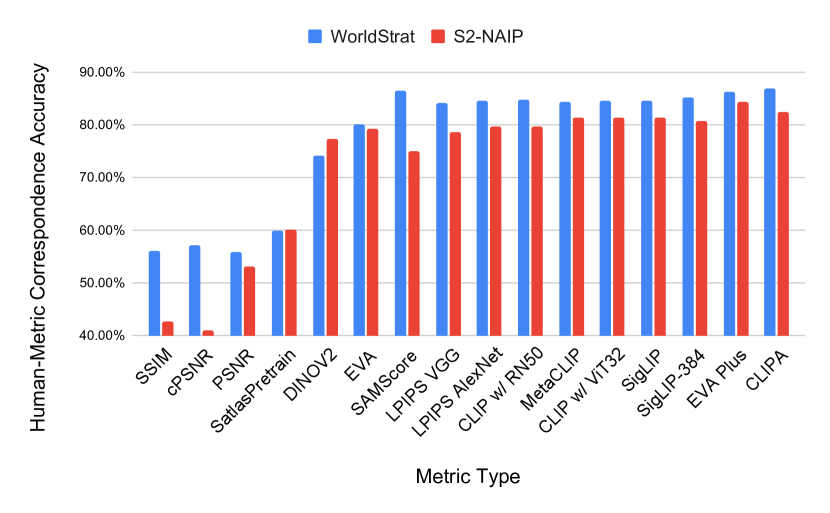
- CLIPScore(特にCLIPA-v2)はSR品質に対する人間の好みに最大84.6%の一致を達成。
- GANs(ESRGAN)は4データセットを通じてCLIPScoreで拡散・L2ベースモデルを上回る。
- CLIPScore損失を用いてESRGANを訓練すると訓練が約18倍速く進み、CLIPScoreを約9ポイント改善。
- SR出力は下流の機械タスクではまだ元のLR画像を用いる方が優れていることが多いが、SR表現は転移学習を改善する可能性がある。
- 大規模なS2-NAIPデータセットとグローバルなESRGANモデルにより、SR出力の公開配布とスケーラブルな実装が可能になる。
より良い研究を、今すぐ始めましょう
論文設計から論文執筆まで、研究時間を劇的に削減しましょう。
クレジットカード登録不要
このレビューはAIが作成し、人間の編集者が確認しました。