
[Paper Review] AGN Selection and Demographics: A New Age with JWST/MIRI
This study leverages JWST/MIRI photometry from the SMILES survey to identify 217 AGN candidates in 34 arcmin² of the GOODS-S field, revealing that 80% are new discoveries—especially among obscured AGNs in massive galaxies—demonstrating MIRI's transformative power in completing the AGN census across cosmic time.
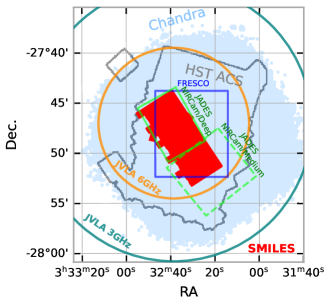
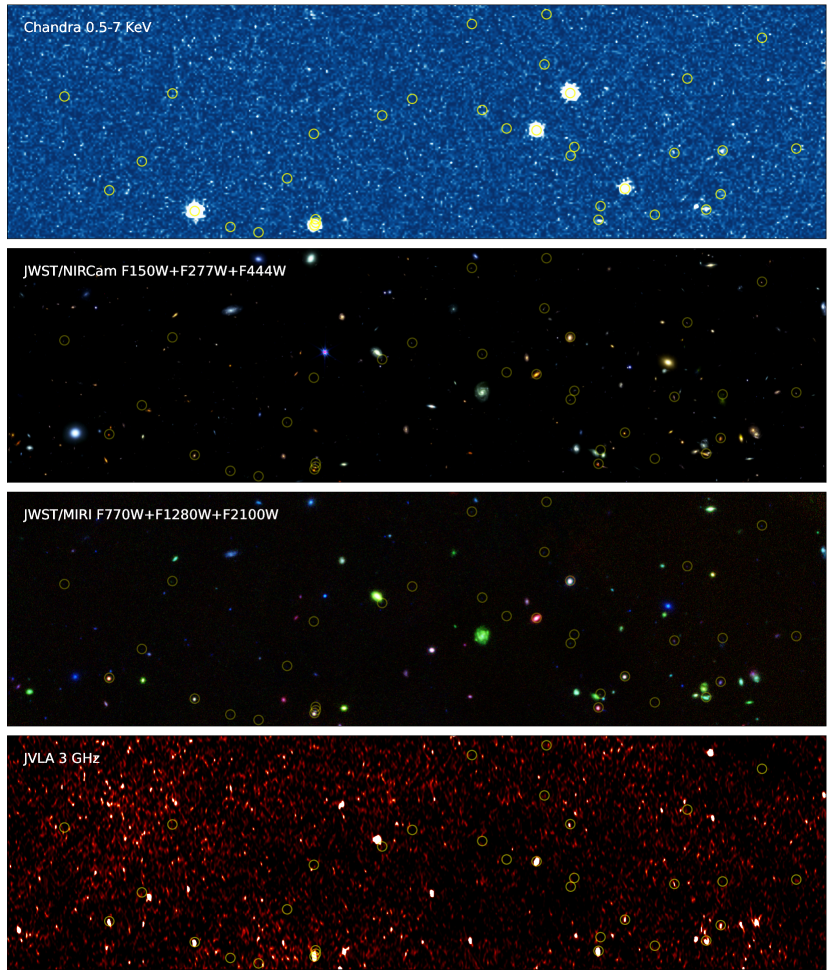
Understanding the co-evolution of supermassive black holes (SMBHs) and their host systems requires a comprehensive census of active galactic nuclei (AGN) behavior across a wide range of redshift, luminosity, obscuration level and galaxy properties. We report significant progress with JWST towards this goal from the Systematic Mid-infrared Instrument Legacy Extragalactic Survey (SMILES). Based on comprehensive SED analysis of 3273 MIRI-detected sources, we identify 217 AGN candidates over a survey area of $\sim$34 arcmin$^2$, including a primary sample of 111 AGNs in normal massive galaxies ($M_{*}>10^{9.5}~M_\odot$) at $z\sim$0--4, an extended sample of 86 AGN {\it candidates} in low-mass galaxies ($M_{*}<10^{9.5}~M_\odot$) and a high-$z$ sample of 20 AGN {\it candidates} at $z\sim$4--8.4. Notably, about 80\% of our MIRI-selected AGN candidates are new discoveries despite the extensive pre-JWST AGN searches. Even among the massive galaxies where the previous AGN search is believed to be thorough, 34\% of the MIRI AGN identifications are new, highlighting the impact of obscuration on previous selections. By combining our results with the efforts at other wavelengths, we build the most complete AGN sample to date and examine the relative performance of different selection techniques. We find the obscured AGN fraction increases from $L_{ m AGN, bol}\sim10^{10}~L_\odot$ to $10^{11}~L_\odot$ and then drops towards higher luminosity. Additionally, the obscured AGN fraction gradually increases from $z\sim0$ to $z\sim4$ with most high-$z$ AGNs obscured. We discuss how AGN obscuration, intrinsic SED variations, galaxy contamination, survey depth and selection techniques complicate the construction of a complete AGN sample.
Motivation & Objective
- To overcome limitations in prior AGN surveys, particularly the underrepresentation of obscured AGNs due to dust extinction.
- To assess the completeness and reliability of AGN selection across different wavelengths, especially in the mid-infrared where obscured AGNs dominate in luminosity.
- To characterize the demographics of AGNs in massive and low-mass galaxies across redshifts z ~ 0–8.4 using SED fitting.
- To evaluate the performance of multi-wavelength selection techniques and identify systematic biases in AGN detection.
- To determine the evolution of obscured AGN fractions with luminosity and redshift, informing models of SMBH-galaxy co-evolution.
Proposed method
- Conducted comprehensive SED fitting on 3,273 MIRI-detected sources using MIRI photometry (5.6–26 μm) combined with NIRCam and HST data at shorter wavelengths.
- Applied SED-based classification to identify AGN candidates based on characteristic mid-infrared dust emission features and spectral energy distribution shapes.
- Defined three samples: 111 AGNs in massive galaxies (M* > 10⁹.⁵ M☉), 86 in low-mass galaxies (M* < 10⁹.⁵ M☉), and 20 high-redshift AGNs (z ~ 4–8.4).
- Compared MIRI-identified AGNs with pre-existing X-ray, optical, and radio catalogs to assess completeness and identify missed sources.
- Quantified obscured AGN fractions by comparing detected AGNs with and without X-ray or optical signatures, accounting for survey depth and sensitivity.
- Used statistical analysis to estimate the fraction of AGNs missed by previous surveys, particularly due to obscuration and low X-ray luminosity.
Experimental results
Research questions
- RQ1What fraction of AGNs in massive galaxies at z ~ 0–4 have been missed by previous multi-wavelength surveys due to obscuration?
- RQ2How does the fraction of obscured AGNs evolve with AGN luminosity and redshift, particularly at z > 4?
- RQ3To what extent do MIRI observations improve the completeness of the AGN census compared to Spitzer and Chandra surveys in the same field?
- RQ4What is the contribution of low-mass galaxies to the overall AGN population at z ~ 2, and how does it compare to massive galaxies?
- RQ5Why are ~80% of MIRI-selected AGNs not detected in X-ray surveys, and what does this imply about their intrinsic properties?
Key findings
- The MIRI-selected AGN number density reached ~6.6 arcmin⁻², exceeding the confusion-limited Spitzer/MIPS 24 μm survey by over two times and surpassing the Chandra X-ray survey by 2.4 times.
- 34% of AGNs in massive galaxies (M* > 10⁹.⁵ M☉) were not previously identified, indicating that obscuration has significantly biased prior AGN surveys.
- For the first time at z ~ 2, JWST/MIRI detects a comparable number of AGNs in low-mass galaxies (log(M*/M☉) < 9.5) as in massive galaxies, revealing a previously hidden population.
- The fraction of obscured AGNs increases with luminosity up to L_AGN,bol ~ 10¹¹ L☉ and then declines at higher luminosities, suggesting a complex evolution in obscuration mechanisms.
- At z > 4, approximately half of the AGN population is likely heavily obscured, with high-redshift AGNs showing strong mid-IR emission but weak or absent X-ray detection.
- About 28% of known AGN candidates in the field were missed by SED analysis, highlighting the extreme diversity of AGN SEDs and the limitations of any single selection method.
Better researchstarts right now
From reading papers to final review, dramatically reduce your research time.
No credit card · Free plan available
This review was created by AI and reviewed by human editors.