[論文レビュー] Open data from the third observing run of LIGO, Virgo, KAGRA and GEO
本論文は、LIGO、 Virgo、 KAGRA、 GEO の第3回観測実施からの公開データリリースを発表します。
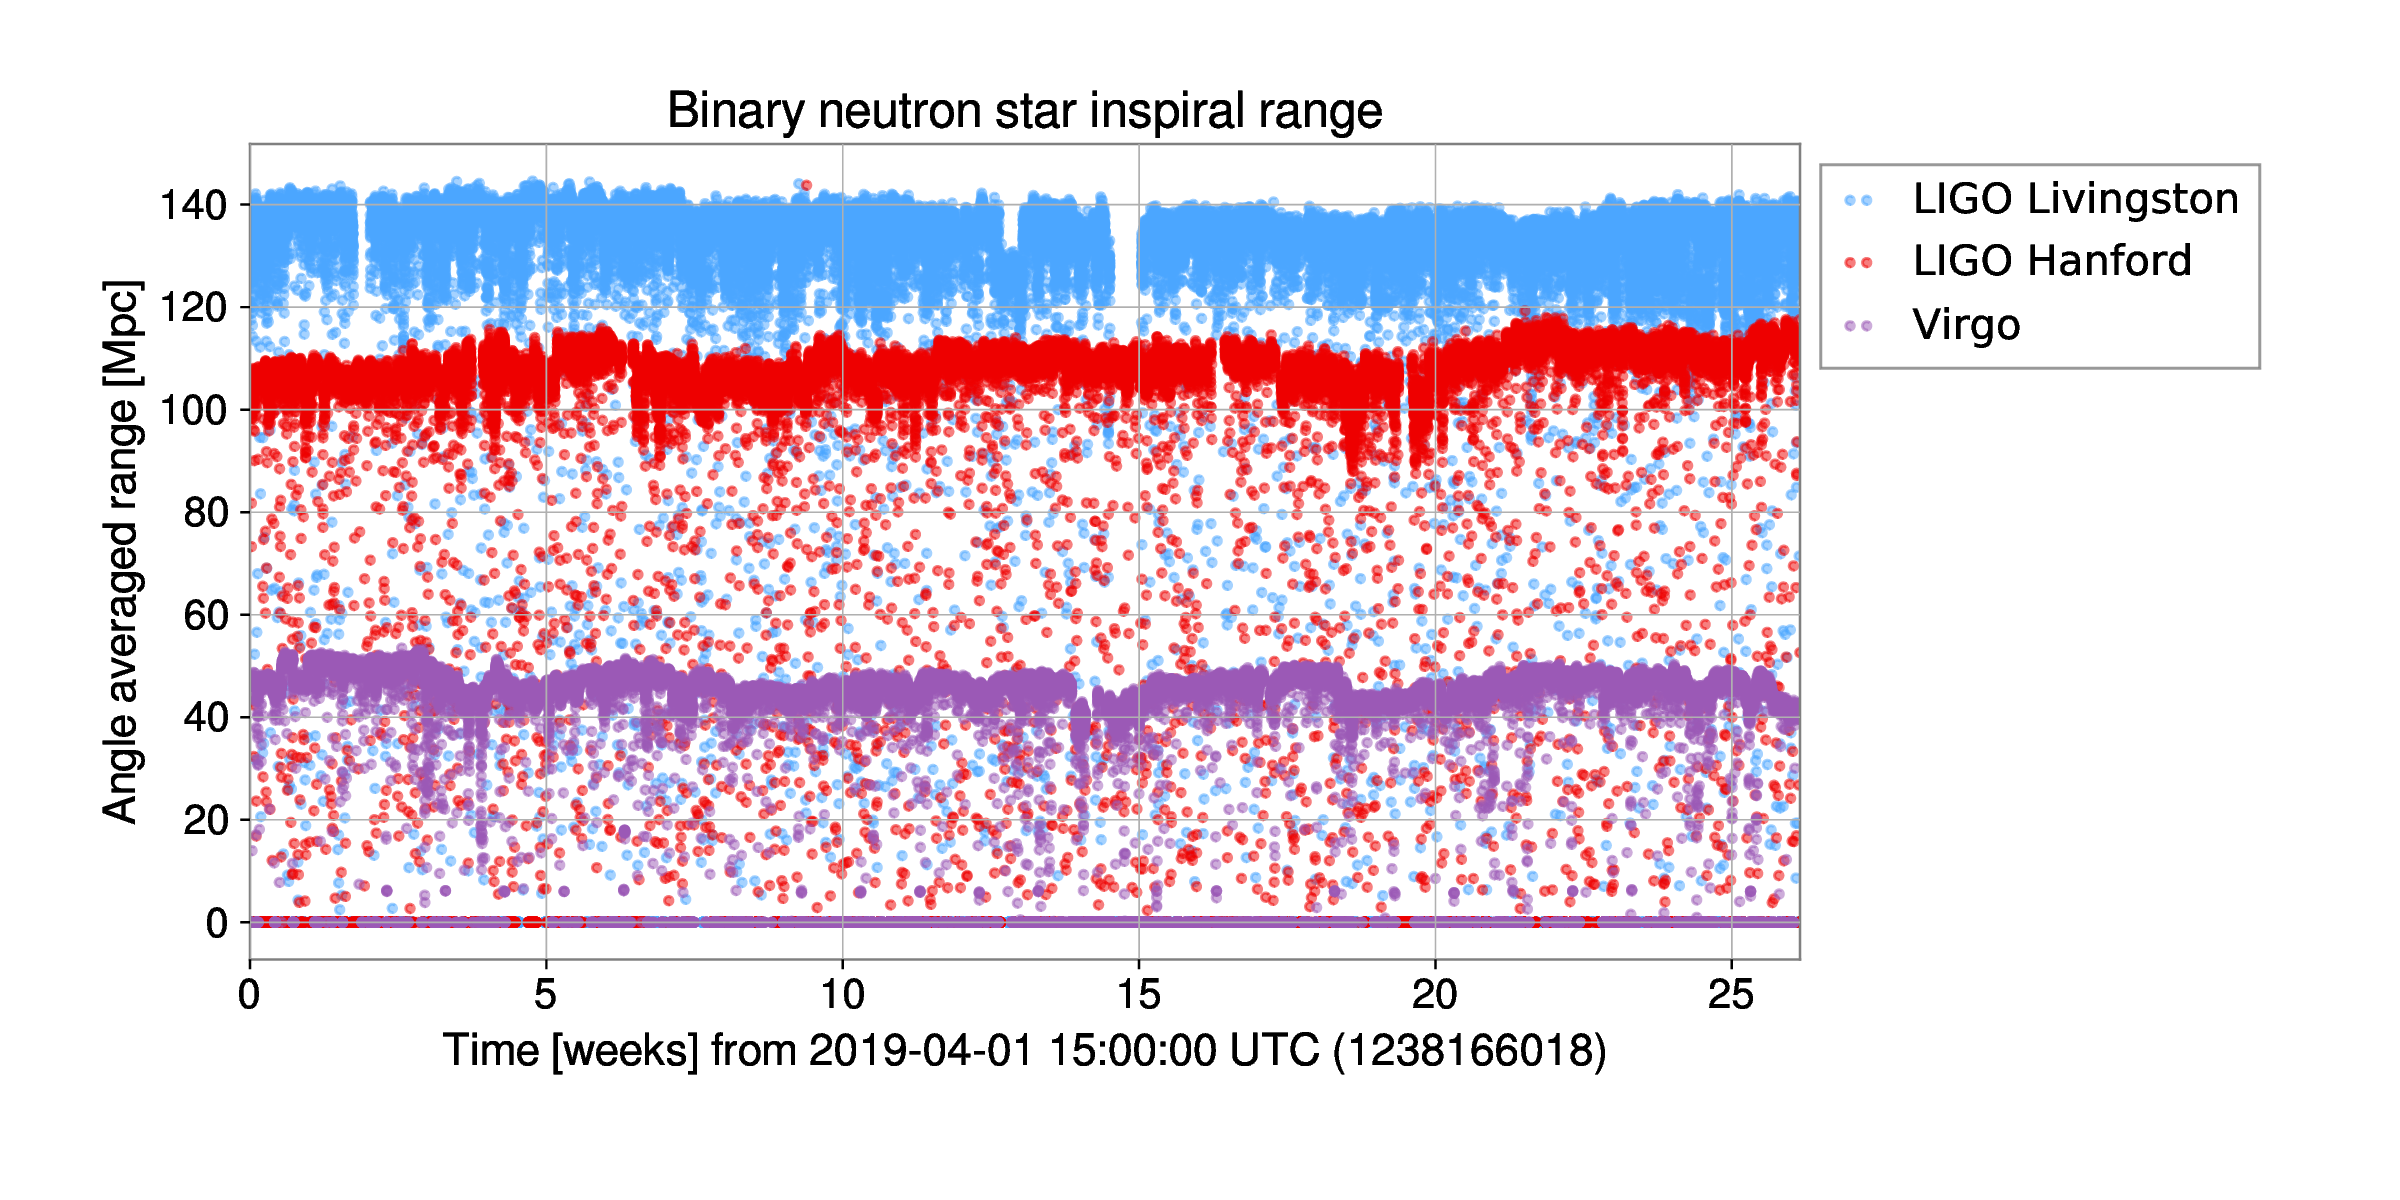
The global network of gravitational-wave observatories now includes five detectors, namely LIGO Hanford, LIGO Livingston, Virgo, KAGRA, and GEO 600. These detectors collected data during their third observing run, O3, composed of three phases: O3a starting in April of 2019 and lasting six months, O3b starting in November of 2019 and lasting five months, and O3GK starting in April of 2020 and lasting 2 weeks. In this paper we describe these data and various other science products that can be freely accessed through the Gravitational Wave Open Science Center at https://gwosc.org. The main dataset, consisting of the gravitational-wave strain time series that contains the astrophysical signals, is released together with supporting data useful for their analysis and documentation, tutorials, as well as analysis software packages.
研究の動機と目的
- LIGO、Virgo、KAGRA、GEO の第3回観測実施(O3)の公開データリリースを説明する。
- このリリースに付随するデータ製品、フォーマット、メタデータを要約する。
- ユーザーの利活用を促進するアクセス手順と使用ガイドラインを説明する。
- このリリースに関連する共同作業、データ品質、キャリブレーション情報を強調する。
提案手法
- O3 から公開されたデータ製品を識別し、カタログ化する。
- リリースに含まれるデータ形式、キャリブレーションメタデータ、品質フラグを概説する。
- データ取得のアクセスインターフェース、ドキュメント、およびデータ取得用の API やポータルを説明する。
- 公開データのガバナンス、ライセンス、引用慣行を要約する。
実験結果
リサーチクエスチョン
- RQ1O3 のオープンデータリリースにはどのデータ製品が含まれていますか?
- RQ2研究者は O3 データおよび関連メタデータにどのようにアクセスし、活用できますか?

より良い研究を、今すぐ始めましょう
論文設計から論文執筆まで、研究時間を劇的に削減しましょう。
クレジットカード登録不要
このレビューはAIが作成し、人間の編集者が確認しました。