
[論文レビュー] Spatial-temporal Analysis of COVID-19's Impact on Human Mobility: the Case of the United States
本研究は、米国における人間の移動行動に及ぼす新型コロナウイルス感染症の空間的・時間的影響を、Appleの移動データとGoogleトレンドを用いて分析している。公衆の認識(検索トレンドで測定)と移動行動の変化の間に14日間の遅れが生じており、地理的近接性に基づく州のクラスタリングが確認され、2020年4月中旬時点でネットワーク中心性指標(次数:−7.7%、近接度:−6.9%、媒介度:−21.6%)が顕著に低下していることが明らかになった。
COVID-19 has been affecting every aspect of societal life including human mobility since December, 2019. In this paper, we study the impact of COVID-19 on human mobility patterns at the state level within the United States. From the temporal perspective, we find that the change of mobility patterns does not necessarily correlate with government policies and guidelines, but is more related to people's awareness of the pandemic, which is reflected by the search data from Google Trends. Our results show that it takes on average 14 days for the mobility patterns to adjust to the new situation. From the spatial perspective, we conduct a state-level network analysis and clustering using the mobility data from Multiscale Dynamic Human Mobility Flow Dataset. As a result, we find that 1) states in the same cluster have shorter geographical distances; 2) a 14-day delay again is found between the time when the largest number of clusters appears and the peak of Coronavirus-related search queries on Google Trends; and 3) a major reduction in other network flow properties, namely degree, closeness, and betweenness, of all states from the week of March 2 to the week of April 6 (the week of the largest number of clusters).
研究の動機と目的
- 米国各州における新型コロナウイルス感染症の公衆認識と人間移動行動の変化の間の時間的遅れを検討すること。
- ネットワーク解析およびクラスタリング技術を用いて、州間移動行動の空間的構造を調査すること。
- パンデミック初期段階における移動ネットワーク特性(次数、近接度、媒介度)の変化を定量的に評価すること。
- 『Coronavirus』のGoogle検索トレンドと、州レベルでの移動行動の変化との関係を検討すること。
- 特に公衆の関心のピークに近い時期に、2020年3月上旬から4月中旬にかけての州レベルの移動行動パターンの変化を評価すること。
提案手法
- 2020年1月13日から7月20日まで、米国全州の相対的日常移動フロー(1月13日を基準に正規化)を取得するために、AppleのCOVID-19移動トレンドレポートを活用した。
- 公衆の認識およびパンデミックへの認識を代理する目的で、州レベルの『Coronavirus』検索ボリュームのGoogleトレンドデータを統合した。
- 州間移動フローをエッジの重みとして用い、州をノードとする州レベルの移動ネットワークを構築した。
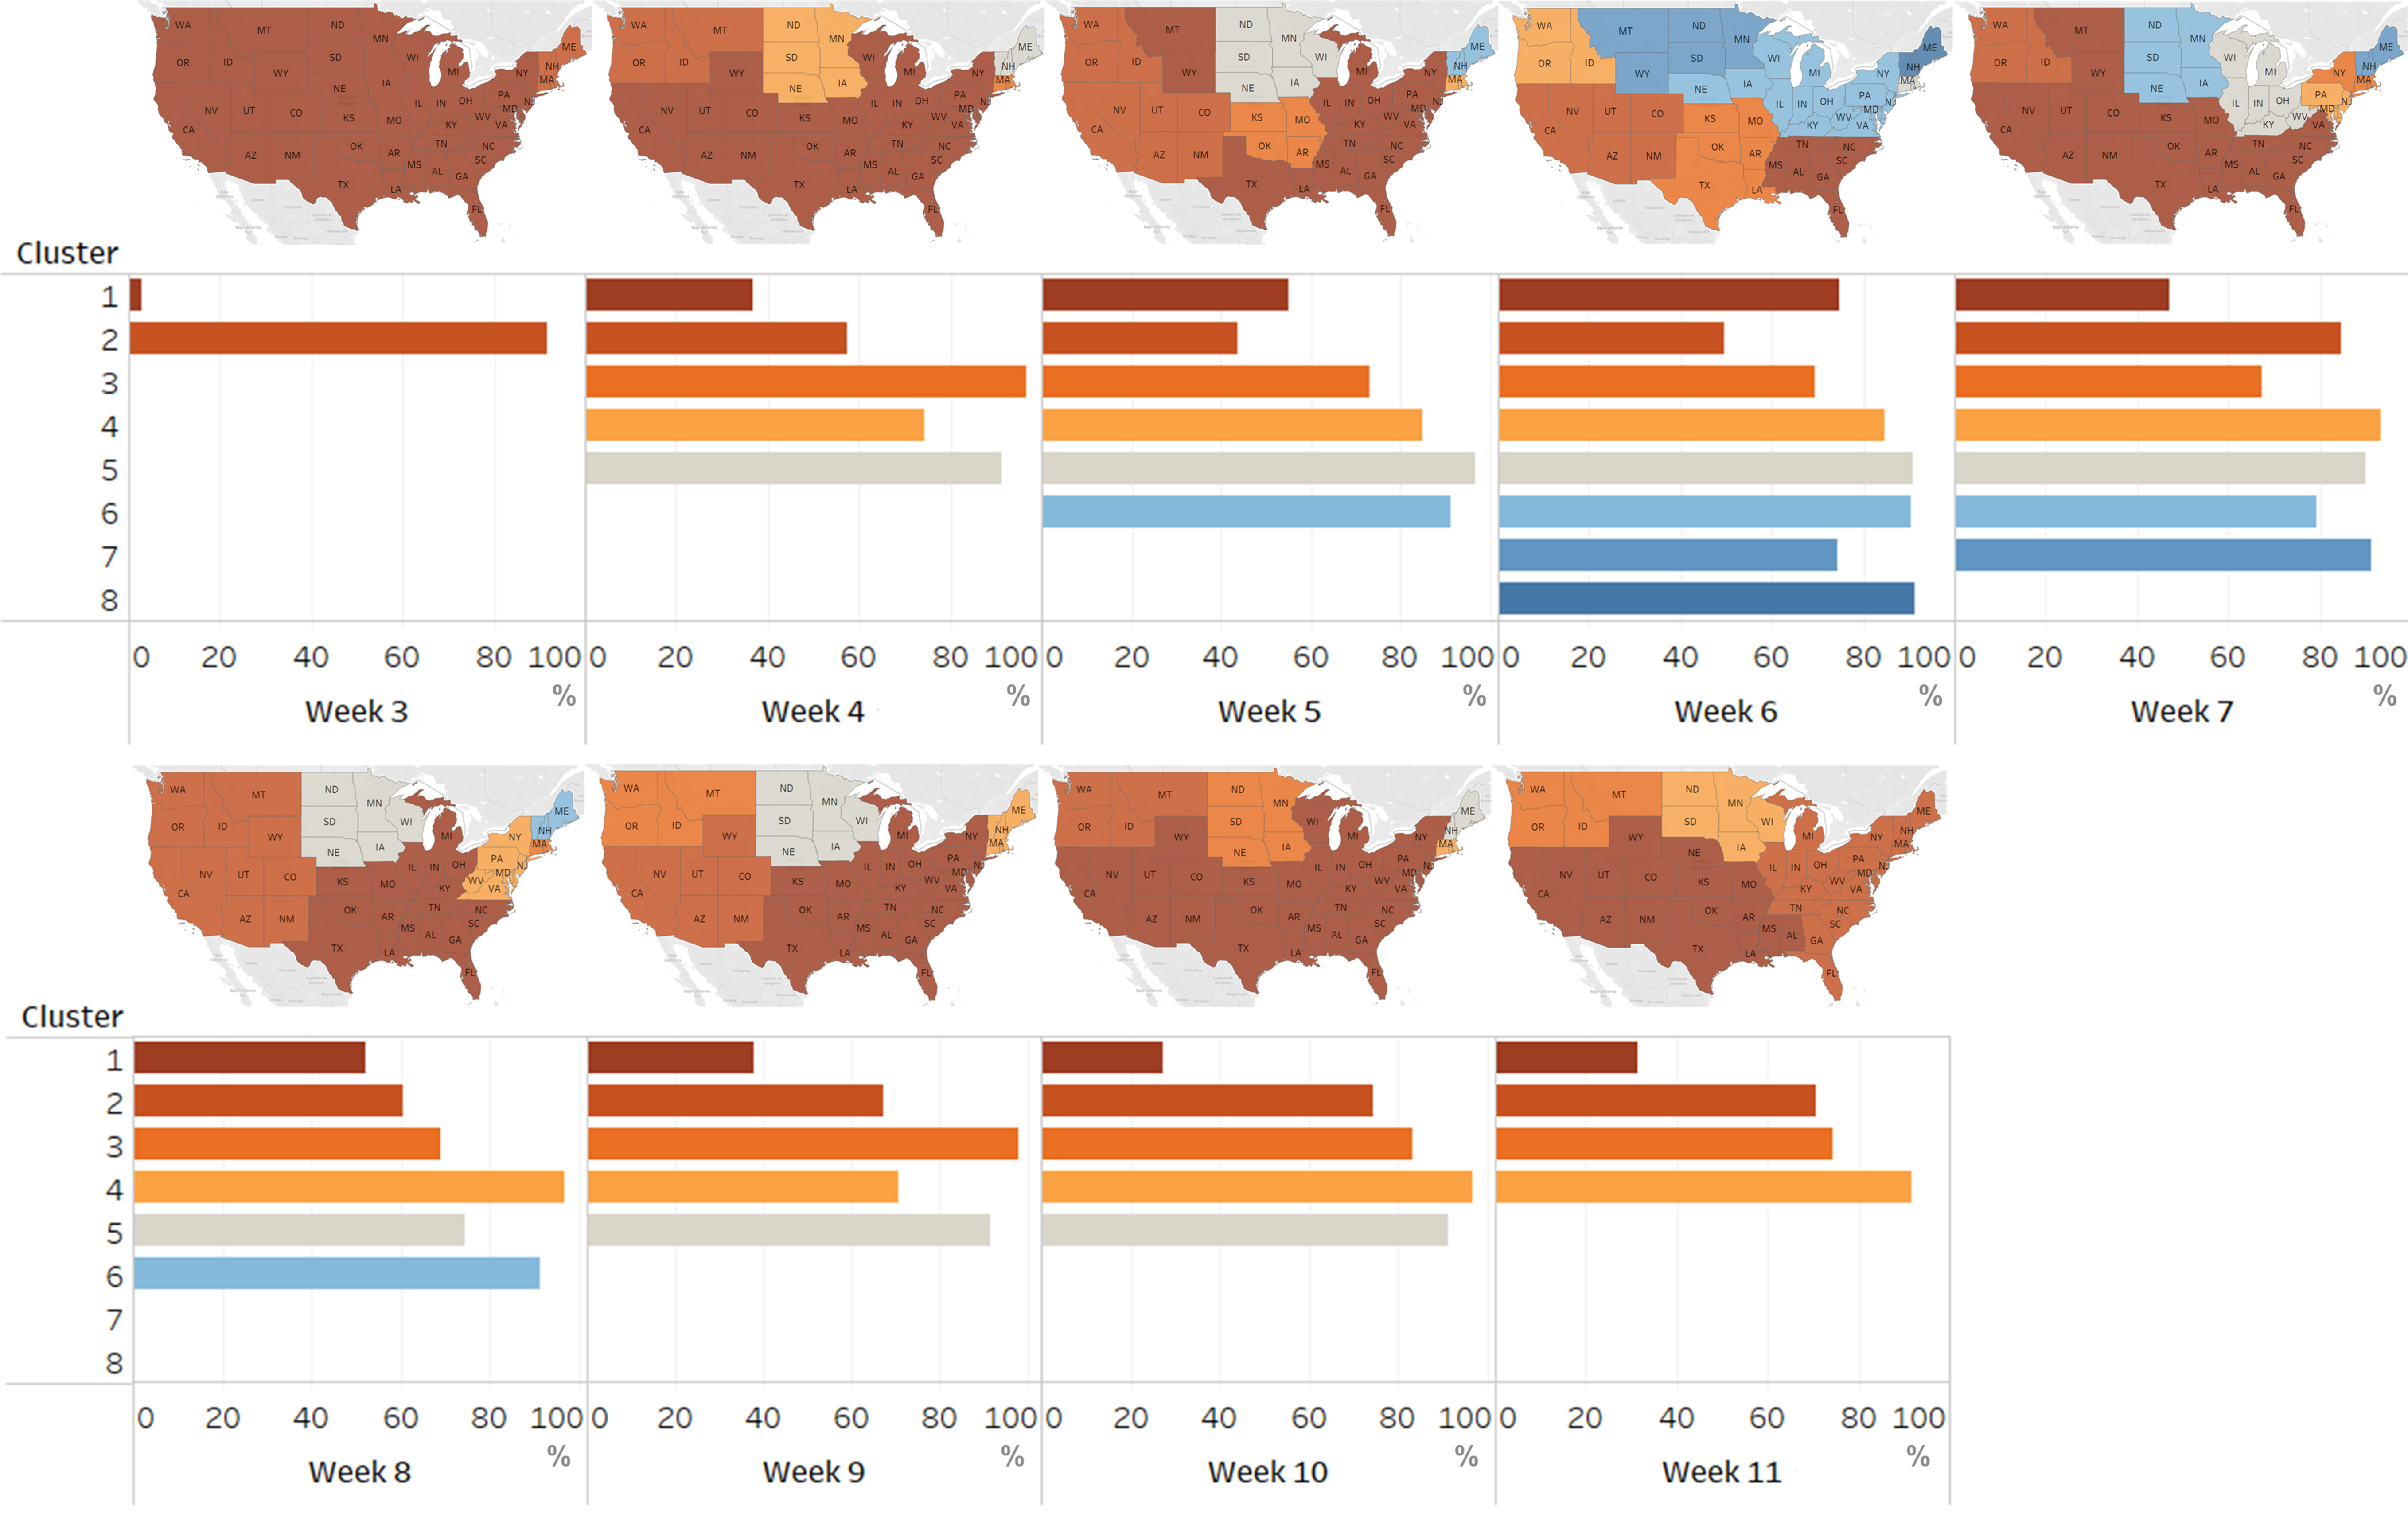
- 地理的距離を空間的制約として用い、類似した移動パターンを示す州のグループを特定するため、ネットワーククラスタリングアルゴリズムを適用した。
- 各州のネットワーク中心性指標(次数、近接度、媒介度)を計算し、移動への影響力および接続性の変化を評価した。
- パンデミック初期段階の代表的週(3月2日週)とピーク隔離時期(4月6日週)を比較し、ネットワーク特性の低下を分析した。
![Figure 1 : The number of days of delay reflected by Apple mobility data [ 2 ] to Google search data [ 15 ] for all states. The average delay of people’s mobility adjustment to their awareness of the pandemic is 14 days.](https://ar5iv.labs.arxiv.org/html/2010.03707/assets/figures/delay.png)
実験結果
リサーチクエスチョン
- RQ1Google検索トレンドによるパンデミック認識の上昇と、米国各州における人間移動行動の変化との間に、測定可能な時間的遅れが存在するか?
- RQ2州間移動行動パターンは空間的にどのようにクラスタリングされ、そのクラスタは地理的近接性に対応しているか?
- RQ3『Coronavirus』のGoogle検索ボリュームのピークと、最大の移動クラスタが出現する時期との間に、時間的関係は何か?
- RQ4パンデミック初期波において、次数、近接度、媒介度といった主要なネットワーク特性が、米国各州でどの程度低下したか?
- RQ5移動ネットワーク中心性の低下が著しかった州はどこか、またその地理的・人口統計的特徴にどのようなパターンが見られるか?
主な発見
- 平均して、Googleトレンドによる公衆認識の上昇と、米国各州における人間移動行動の変化の間には14日間の遅れが存在する。
- 『Coronavirus』のGoogle検索ボリュームのピークから約14日後に、最大の移動クラスタが出現しており、行動適応の時間的遅れが裏付けられた。
- 同じ移動クラスタに属する州同士は、地理的にも近接している傾向にあり、近接性が移動ネットワークの構造に重要な役割を果たしていることが示された。
- 3月2日週から4月6日週にかけて、米国全州でネットワーク中心性が低下した。平均次数は7.7%低下、近接度は6.9%低下、媒介度は21.6%低下した。
- ネバダ州、ウィスコンシン州、ニュージャージー州は、それぞれ97.8%、57.1%、53.7%の媒介度低下を示し、移動ハブとしての役割が著しく低下した。
- 次数、近接度、媒介度の低下が著しかった上位10州では、それぞれ標準偏差が9.7%、4.0%、27.3%に達しており、州ごとの移動の混乱度に顕著なばらつきが見られた。
より良い研究を、今すぐ始めましょう
論文の読解から最終レビューまで、研究時間を劇的に削減しましょう。
クレジットカード登録不要
このレビューはAIが作成し、人間の編集者が確認しました。