
[논문 리뷰] Agri-GNN: A Novel Genotypic-Topological Graph Neural Network Framework Built on GraphSAGE for Optimized Yield Prediction
Agri-GNN는 농업 플롯을 그래프의 노드로 표현하고, 공간적 및 유전자 유사성에 기반해 간선을 정의함으로써 수확량을 모델링하는 GraphSAGE 기반의 새로운 그래프 신경망 프레임워크이다. 아이오와 농장 데이터에서 수확량 예측에 R² = 0.876를 달성하여, 유전자-위치 상호작용의 복잡한 특성을 다루는 데 있어 기존 기준 모델들을 크게 능가한다.
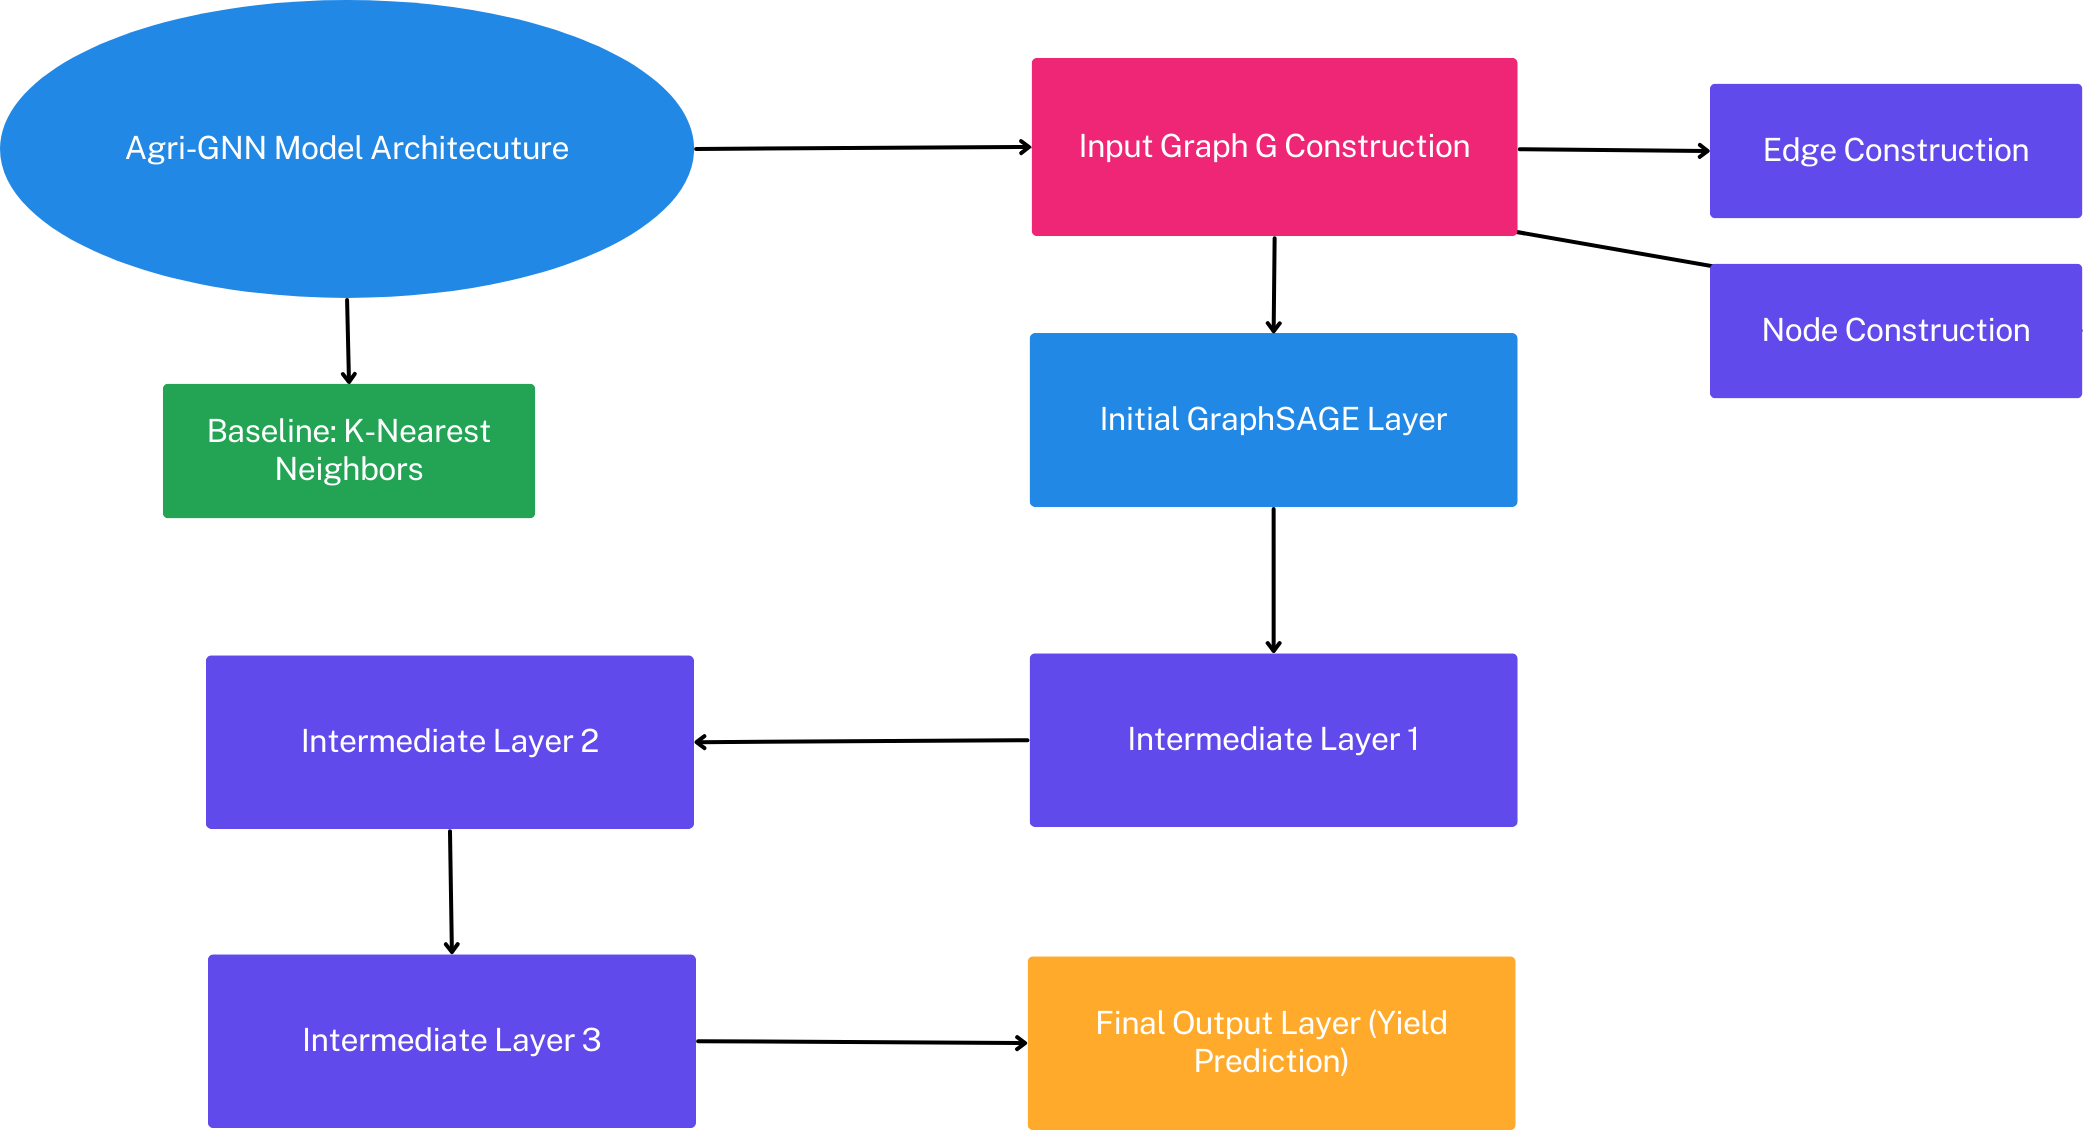
Agriculture, as the cornerstone of human civilization, constantly seeks to integrate technology for enhanced productivity and sustainability. This paper introduces $ extit{Agri-GNN}$, a novel Genotypic-Topological Graph Neural Network Framework tailored to capture the intricate spatial and genotypic interactions of crops, paving the way for optimized predictions of harvest yields. $ extit{Agri-GNN}$ constructs a Graph $\mathcal{G}$ that considers farming plots as nodes, and then methodically constructs edges between nodes based on spatial and genotypic similarity, allowing for the aggregation of node information through a genotypic-topological filter. Graph Neural Networks (GNN), by design, consider the relationships between data points, enabling them to efficiently model the interconnected agricultural ecosystem. By harnessing the power of GNNs, $ extit{Agri-GNN}$ encapsulates both local and global information from plants, considering their inherent connections based on spatial proximity and shared genotypes, allowing stronger predictions to be made than traditional Machine Learning architectures. $ extit{Agri-GNN}$ is built from the GraphSAGE architecture, because of its optimal calibration with large graphs, like those of farming plots and breeding experiments. $ extit{Agri-GNN}$ experiments, conducted on a comprehensive dataset of vegetation indices, time, genotype information, and location data, demonstrate that $ extit{Agri-GNN}$ achieves an $R^2 = .876$ in yield predictions for farming fields in Iowa. The results show significant improvement over the baselines and other work in the field. $ extit{Agri-GNN}$ represents a blueprint for using advanced graph-based neural architectures to predict crop yield, providing significant improvements over baselines in the field.
연구 동기 및 목표
- 농업 데이터의 복잡한 상호관계를 포착하지 못하는 전통적 기계학습 모델의 한계를 해결한다.
- 유전자, 공간, 시간, 환경 등의 다중 모odal 데이터를 통합하여 통합 예측 프레임워크를 구축한다.
- 유전자 유사성과 공간 유사성에 기반해 상호연결된 노드로 농업 플롯을 모델링하여 수확량 예측 정확도를 향상시킨다.
- 정밀 농업과 기후 적응형 농업에 적합한 확장성 있고 모듈형이며 적응형 프레임워크를 개발한다.
- 그래프 기반 학습을 활용해 실제 농업 데이터셋에서 기존 모델들을 능가하는 성능을 입증한다.
제안 방법
- 각 농업 플롯을 노드로 하고, 공간적 근접성과 유전자 유사성에 기반해 간선을 형성하는 그래프 𝒢를 구축한다.
- 유전자-위치 필터를 적용하여 유사한 이웃 노드의 특징을 집계함으로써 노이즈를 감소시키고 관련성이 높은 이웃에 초점을 맞춘다.
- 노드 임베딩을 생성하기 위해 인덕티브 학습 프레임워크인 GraphSAGE를 활용하여 추론 시에 새로운 플롯으로 일반화할 수 있도록 한다.
- 식생 지수, 시간, 유전자형, 위치 등의 다양한 데이터 모달리티를 통합된 그래프 기반 표현으로 통합한다.
- 레이블이 부여된 수확량 데이터를 사용해 엔드 투 엔드로 모델을 훈련시키며, RMSE, MAE, R² 지표를 최적화한다.
- 학습된 노드 임베딩의 분석을 위해 t-SNE 시각화를 활용하여 유사한 플롯이 의미 있는 방식으로 군집화되었는지 검증한다.
실험 결과
연구 질문
- RQ1공간적 및 유전자적 관계를 모두 모델링하는 그래프 신경망이 기존 기계학습 모델 대비 수확량 예측 정확도를 향상시킬 수 있는가?
- RQ2제한된 레이블이 있는 대규모이고 이질적인 농업 데이터셋에 대해 GraphSAGE 기반의 인덕티브 학습이 얼마나 효과적으로 적용될 수 있는가?
- RQ3유전적, 공간적, 시간적, 환경적 데이터를 통합함으로써 수확량 예측 성능이 얼마나 향상되는가?
- RQ4학습된 노드 임베딩은 농업 플롯의 의미 있는 생물학적 및 공간적 군집을 얼마나 잘 반영하는가?
- RQ5Agri-GNN 프레임워크는 최소한의 피팅 튜닝으로 새로운, 알려지지 않은 농업 플롯에 일반화할 수 있는가?
주요 결과
- Agri-GNN는 아이오와 암스 지역의 실제 농장 데이터에서 수확량 예측에 R² = 0.876의 성능을 달성하여 기존 기준 모델을 크게 능가했다.
- 동일한 데이터셋과 평가 환경에서 기존 연구인 Chattopadhyay et al. (2023)보다도 뛰어난 성능을 보였다.
- 학습된 임베딩의 t-SNE 시각화 결과에서 유전자 및 공간 유사성에 기반한 일관된 플롯 군집화가 관찰되어, 모델이 의미 있는 관계를 포착할 수 있음을 검증했다.
- 유전자-위치 필터링을 통한 특징 집계 시 노이즈 감소로 더 견고하고 정확한 예측이 가능해졌다.
- Agri-GNN의 인덕티브 학습 능력 덕분에 새로운, 알려지지 않은 플롯으로도 효과적인 일반화가 가능하여 확장성과 적응성의 잠재력을 입증했다.
- 다양한 농장 조건에서 데이터 변동성과 불확실성에 강건하게 유지되어 일관된 성능을 보였다.
더 나은 연구,지금 바로 시작하세요
논문 읽기부터 검토까지, 연구 시간을 획기적으로 줄여보세요.
카드 등록 없음 · 무료 플랜 제공
이 리뷰는 AI가 만들고, 인간 에디터가 검토했습니다.