
Charts drawn from your table, with no invented numbers
Upload a CSV or Excel table and say what to plot, and get a chart for your paper drawn from the table's real values.
No credit card · Free plan available
Trusted by students and researchers across the world


Charts drawn with Nubint Figure
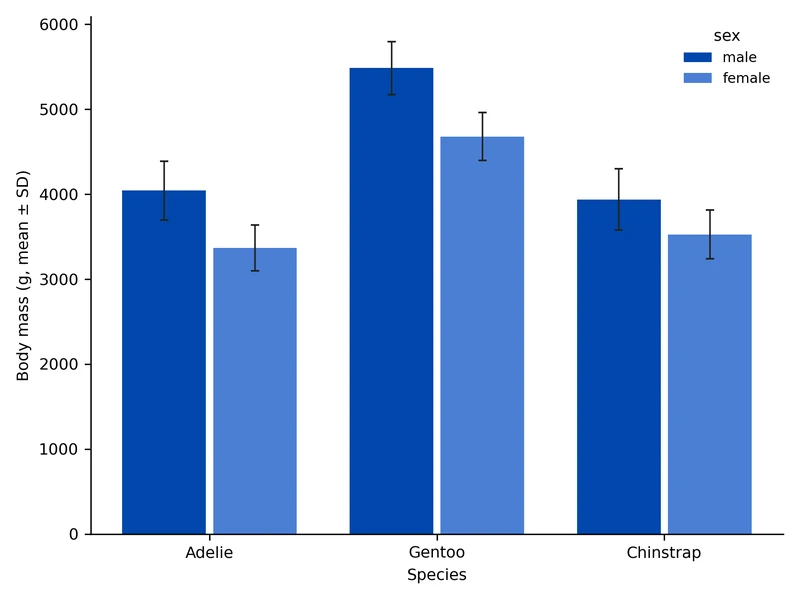
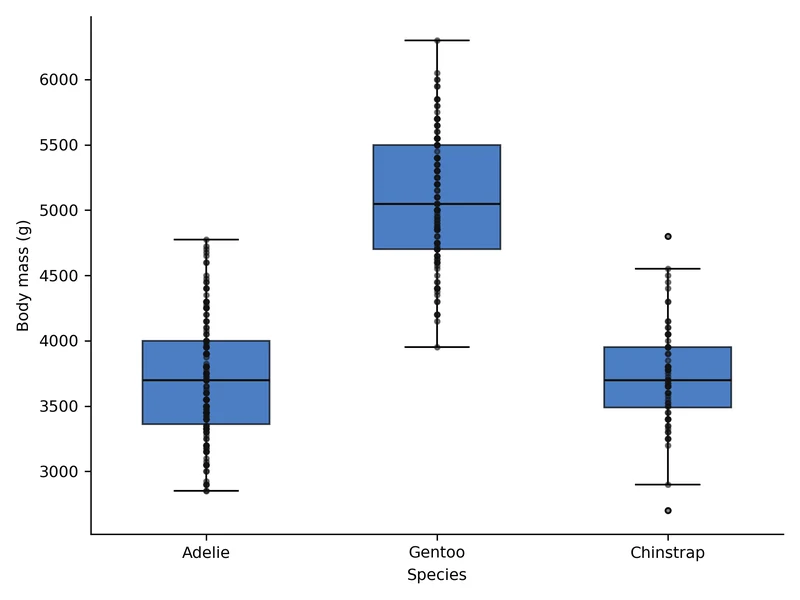
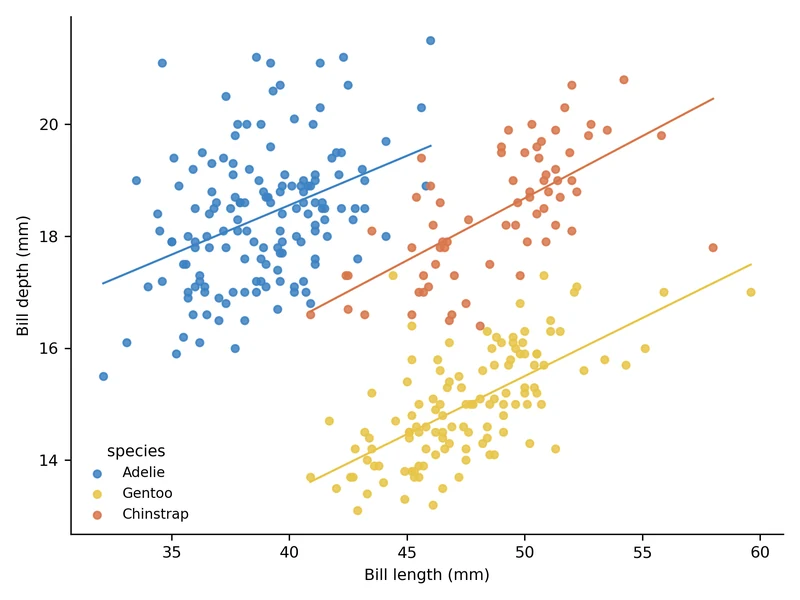
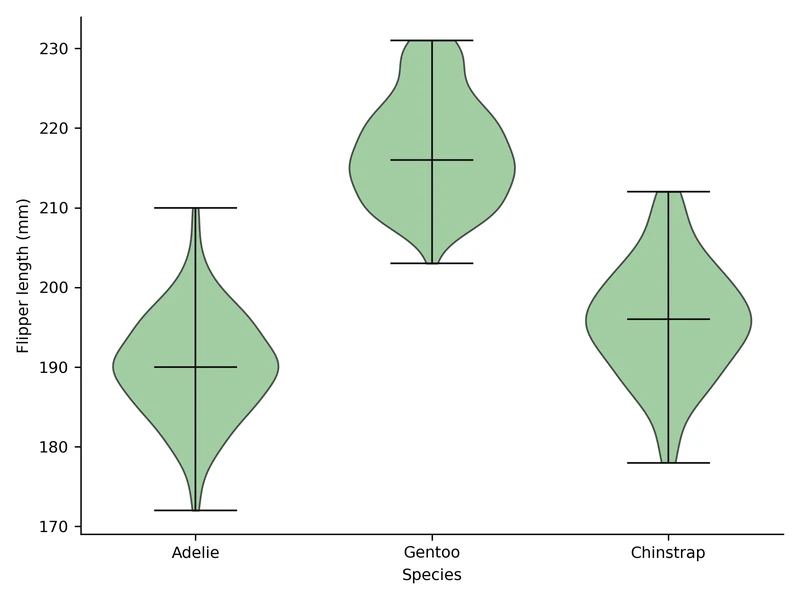
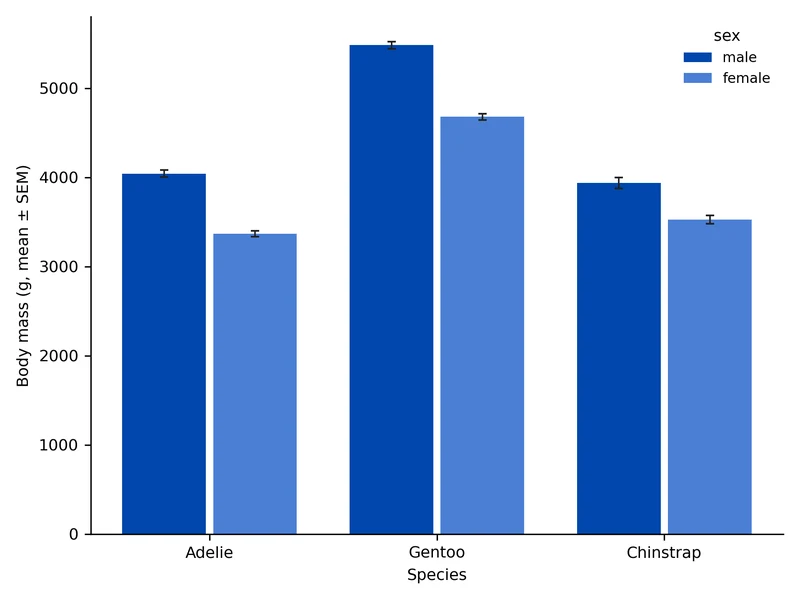
Drawn by Nubint Figure's charts from public data: Palmer Penguins and NOAA Mauna Loa CO₂ measurements.
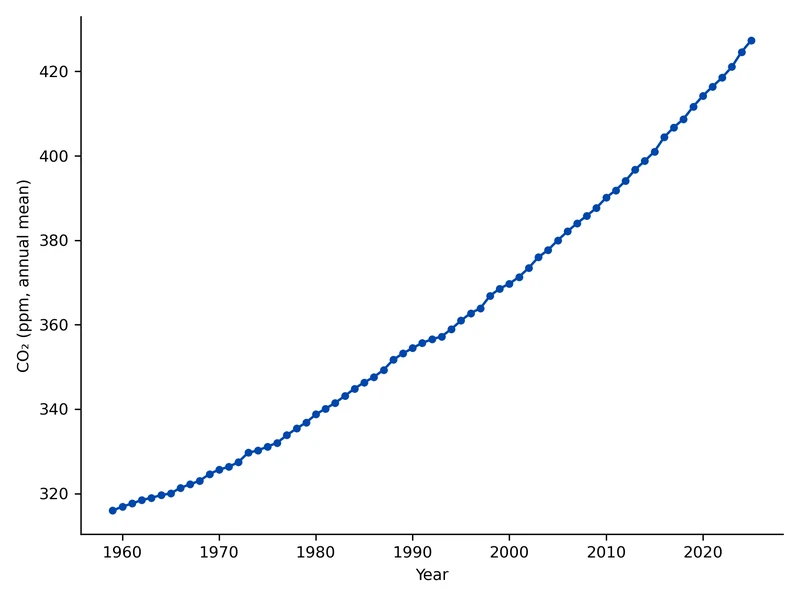
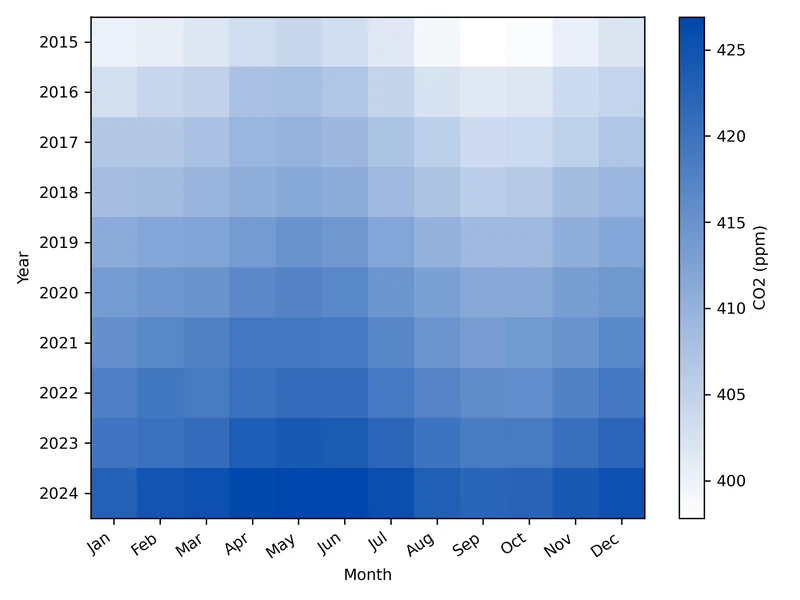
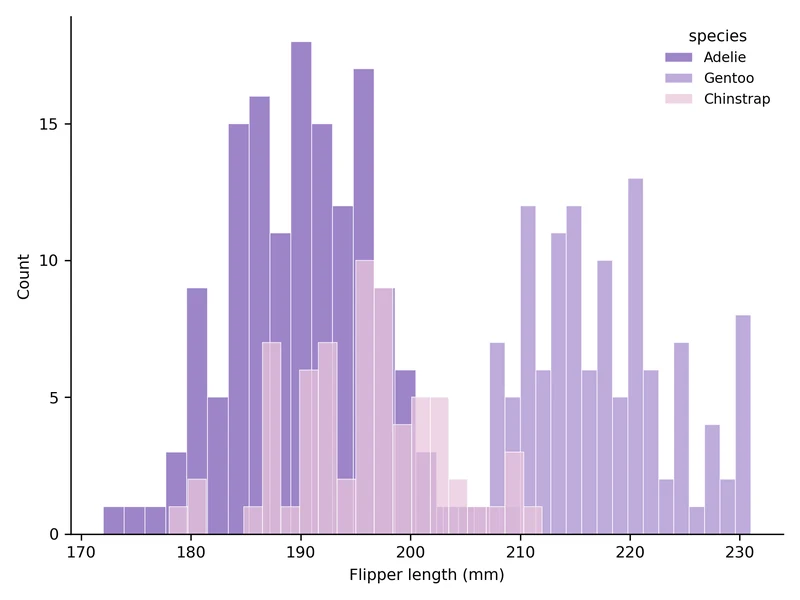
Upload a table, plot the real values
The AI only decides which columns to plot as which chart, and code draws it from your table's values. Cells it can't read are left out, not made up.
Describe your figure, get it publication-ready
penguins.csv
8 columns · 333 rows
Columns: species, island, bill_length_mm, bill_depth_mm, flipper_length_mm, body_mass_g, sex, year
Plot body mass by species, split by sex, as a bar chart with mean and standard deviation
Chart type, journal style and colors
Choose bar, line, scatter, box, violin, heatmap or histogram, or leave it on Auto. Nature, Science, Cell, PLOS ONE and ACS styles draw at the width and text size those journals' figures use.
Chart Type
Journal Style
Nature
89 mm wide · 7 pt text · thin lines
Colors
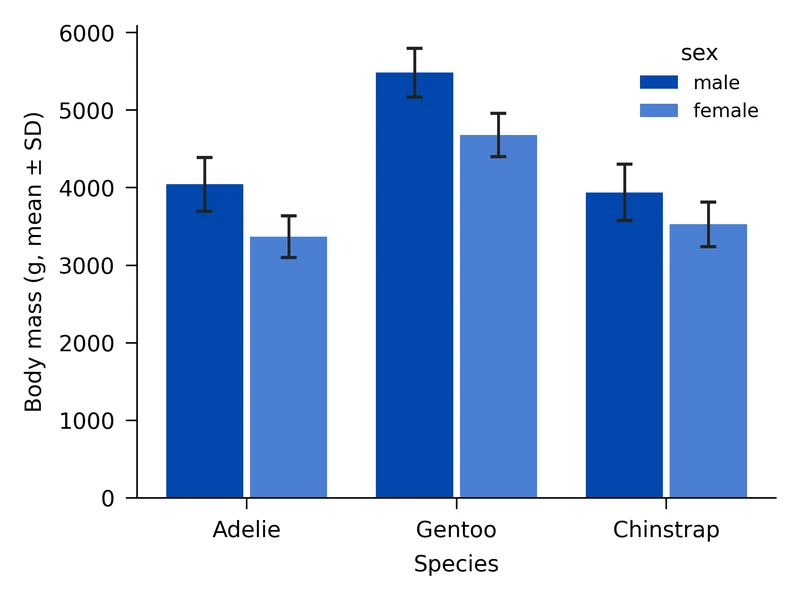
Ask for a change, redraw from the same table
Say "switch the error bars to standard error" or "put the y-axis on a log scale" and the chart is redrawn from the same table. You don't need to upload the table again for each change.
How It Works
- 01
Upload a table
Upload a table file or paste a table.
- 02
Say what to plot
Say what you want to compare, and pick a chart type, journal style or colors if you like.
- 03
Download
Download the finished chart as PNG or JPG.
FAQ
Frequently Asked Questions
Common questions about this feature
Start your chart with one table
No credit card · Free plan available