
[論文レビュー] A scalable system to measure contrail formation on a per-flight basis
本論文は、GOES-16 衛星赤外線画像から恒久的 contrail を検出し、個々のフライトセグメントにマッチングするスケーラブルで自動化されたシステムを提示する。これにより、160万件のフライトに対して個別フライト単位での contrail 発生を評価可能となる。主な貢献は、現在の天気ベースの contrail 予測モデルの不完全性が、全体の費用対効果にもかかわらず、contrail 避免のコストを約10倍に引き上げることを大規模な実証的ベンチマークで示したことである。
Persistent contrails make up a large fraction of aviation's contribution to global warming. We describe a scalable, automated detection and matching (ADM) system to determine from satellite data whether a flight has made a persistent contrail. The ADM system compares flight segments to contrails detected by a computer vision algorithm running on images from the GOES-16 Advanced Baseline Imager. We develop a 'flight matching' algorithm and use it to label each flight segment as a 'match' or 'non-match'. We perform this analysis on 1.6 million flight segments. The result is an analysis of which flights make persistent contrails several orders of magnitude larger than any previous work. We assess the agreement between our labels and available prediction models based on weather forecasts. Shifting air traffic to avoid regions of contrail formation has been proposed as a possible mitigation with the potential for very low cost/ton-CO2e. Our findings suggest that imperfections in these prediction models increase this cost/ton by about an order of magnitude. Contrail avoidance is a cost-effective climate change mitigation even with this factor taken into account, but our results quantify the need for more accurate contrail prediction methods and establish a benchmark for future development.
研究の動機と目的
- 個々のフライトが恒久的 contrail を形成するかどうかを、衛星データとフライトデータを用いてスケーラブルかつ自動化された手法で特定すること。
- 天気予報と再解析データを用いた予測と、実際の観測された contrail を比較することで、大規模な実証的ベンチマークを構築し、contrail 予測モデルの評価を行うこと。
- 特に相対湿度の誤差が、contrail 避免戦略の費用対効果にどのように影響するかを定量化すること。
- モデル入力ではなく、現実の観測データを用いて、既存の contrail 予測モデルの性能を評価すること。
- 将来的な予測の改善と緩和戦略の検証の基盤を提供すること。
提案手法
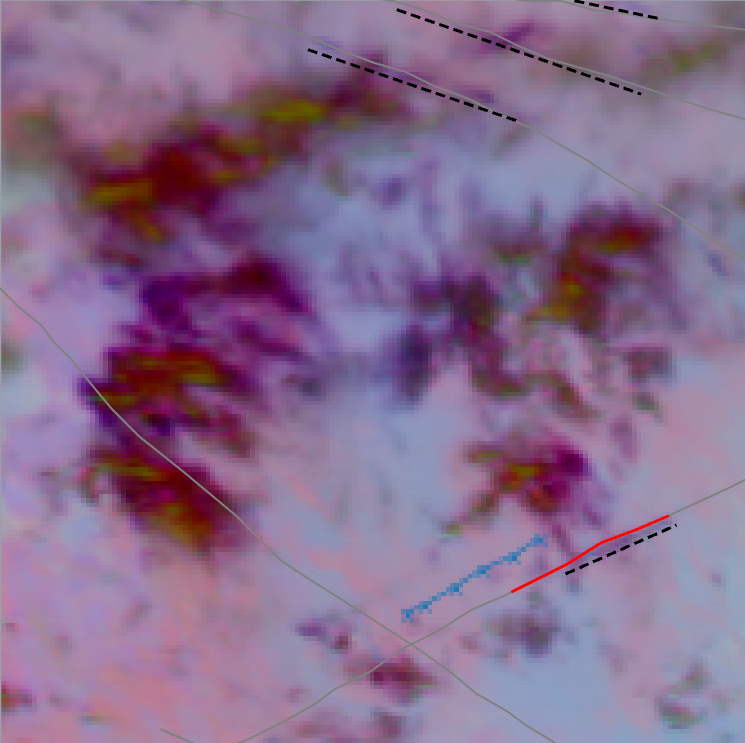
- GOES-16 Advanced Baseline Imager (ABI) 赤外線画像を用いてトレーニングされたコンピュータビジョンモデルを活用し、恒久的 contrail を検出する。
- 空間的・時間的近接性に基づき、検出された contrail をフライトセグメントにマッチングするためのフライトマッチングアルゴリズムを適用し、精度を最適化するためのしきい値を設定する。
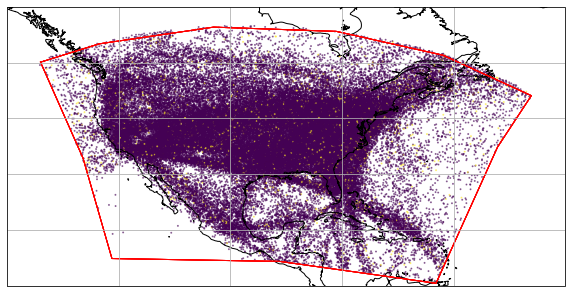
- 連続する米国本土の160万件のフライトセグメントを、168時間分の衛星データで処理する。
- 天気予報と再解析データを用いた複数の contrail 発生モデルの予測と、観測された contrail のマッチングを比較する。
- 実証的真値と比較して、モデルの性能を精度と再現率の指標で評価する。
- 160万件のフライトセグメントと12,000件の検出済み contrail を用いたデータセットを構築し、将来的なモデル開発のためのベンチマークを確立する。
実験結果
リサーチクエスチョン
- RQ1米国本土のフライトの何パーセントが恒久的 contrail を発生させ、時間帯・季節・フライト密度によってその割合はどのように変化するか?
- RQ2実際の衛星観測と照らし合わせた場合、現在の天気ベースのモデルがどれほど正確に contrail 発生を予測できるか?
- RQ3上層大気の湿度予測の誤差が、contrail 予測モデルの性能にどの程度悪影響を及えるか?
- RQ4予測モデルの不完全性が、contrail 発生を避けるために航空交通を再ルート化する戦略の費用対効果にどのように影響するか?
- RQ5スケーラブルで自動化されたシステムが、大規模なスケールで衛星検出済み contrail を個々のフライトセグメントに信頼性高くマッチングできるか?
主な発見
- 本システムは、160万件のフライトセグメントに対して contrail 発生を成功裏に同定し、過去のあらゆる研究と比べて10倍以上のデータ量を扱った。
- 約10%のフライトが恒久的 contrail を発生させ、日中の時間帯やフライト密度の高い地域で発生率が高くなる傾向が見られた。
- 天気予報に基づく contrail 予測モデルは、入力データソースによって精度と再現率の差が顕著に現れ、顕著な性能ギャップを示した。
- 上層大気の相対湿度予測の不完全性が、1トンのCO2同等量を避けるごとのコストを約10倍に引き上げることが判明した。
- この不完全性にもかかわらず、contrail 避免は依然として非常に費用対効果が高く、コストより1,000倍以上の利益が見込まれる。
- 本研究は、将来的な contrail 予測モデルの評価と改善のための新しいベンチマークデータセットと手法を確立した。
より良い研究を、今すぐ始めましょう
論文の読解から最終レビューまで、研究時間を劇的に削減しましょう。
クレジットカード登録不要
このレビューはAIが作成し、人間の編集者が確認しました。