
[論文レビュー] Dead or Alive: Continuous Data Profiling for Interactive Data Science
本論文では、データフレームの変更に伴いリアルタイムで更新されるインタラクティブなビジュアライゼーション要約と要約統計を自動的に表示することで、継続的・ライブなデータプロファイリングを可能にするJupyterノートブック拡張機能であるAutoProfilerを紹介する。ユーザースタディーにおいて、91%のインサイトが手動でのコーディングではなくこのツールを通じて発見された。これは、ライブプロファイリングとオンデマンドプロファイリングの両方が、インタラクティブなデータサイエンスワークフローにおけるインサイト検出とデータ品質の認識を顕著に向上させることを示している。
Profiling data by plotting distributions and analyzing summary statistics is a critical step throughout data analysis. Currently, this process is manual and tedious since analysts must write extra code to examine their data after every transformation. This inefficiency may lead to data scientists profiling their data infrequently, rather than after each transformation, making it easy for them to miss important errors or insights. We propose continuous data profiling as a process that allows analysts to immediately see interactive visual summaries of their data throughout their data analysis to facilitate fast and thorough analysis. Our system, AutoProfiler, presents three ways to support continuous data profiling: it automatically displays data distributions and summary statistics to facilitate data comprehension; it is live, so visualizations are always accessible and update automatically as the data updates; it supports follow up analysis and documentation by authoring code for the user in the notebook. In a user study with 16 participants, we evaluate two versions of our system that integrate different levels of automation: both automatically show data profiles and facilitate code authoring, however, one version updates reactively and the other updates only on demand. We find that both tools facilitate insight discovery with 91% of user-generated insights originating from the tools rather than manual profiling code written by users. Participants found live updates intuitive and felt it helped them verify their transformations while those with on-demand profiles liked the ability to look at past visualizations. We also present a longitudinal case study on how AutoProfiler helped domain scientists find serendipitous insights about their data through automatic, live data profiles. Our results have implications for the design of future tools that offer automated data analysis support.
研究の動機と目的
- インタラクティブなデータサイエンスワークフローにおける手動によるデータプロファイリングの非効率性と一貫性の欠如を解消すること。
- データプロファイルの生成を自動化することで、探索的データ分析(EDA)における認知的負荷と時間的負担を軽減すること。
- ライブプロファイリングとオンデマンドプロファイリングの違いが、インサイト検出とユーザーワークフロー統合に与える影響を評価すること。
- 自動化ツールが、コードエクスポートを通じて後続分析を支援する中で、偶然のインサイト発見をどのように支援できるかを検討すること。
提案手法
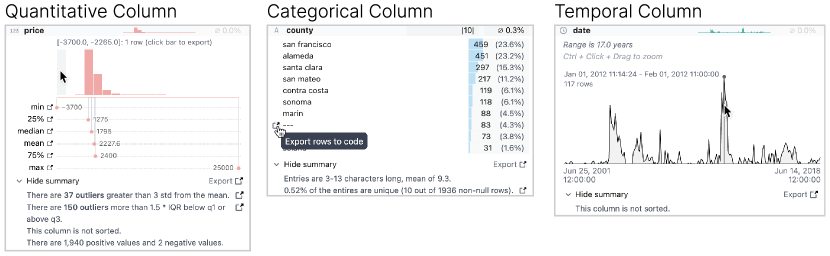
- AutoProfilerはJupyterノートブックに統合され、データフレームやその各カラムが作成または更新された時点で、自動的にデータ分布と要約統計を表示する。
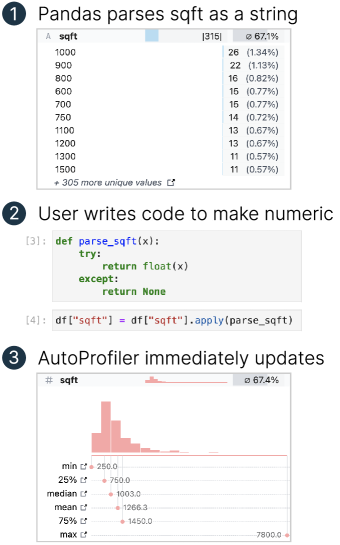
- システムはライブ更新を提供し、メモリ内のデータの現在の状態がリアルタイムで反映されたビジュアライゼーションを保証する。
- ユーザーの体験とパフォーマンスを比較するための静的でインラインな代替手段として、オンデマンドプロファイリングもサポートする。
- ツールは、ビジュアライゼーションやデータ操作用の再利用可能なコードテンプレートを生成し、インターフェースから直接コードをエクスポート・変更可能にする。
- 継続的プロファイリングが実世界のデータサイエンスタスクにおいて予期しないデータ品質のインサイトをもたらす様子を観察するため、縦断的ケーススタディを実施した。
- 16名の参加者を対象とした制御付きユーザースタディーで、ライブ版とオンデマンド版のAutoProfilerを比較し、インサイト生成と使いやすさを評価した。
実験結果
リサーチクエスチョン
- RQ1データ分析の過程で、継続的・ライブなデータプロファイリングとオンデマンドプロファイリングの両者を比較した場合、どちらがインサイト検出をより効果的に支援するか?
- RQ2自動化されたデータプロファイルは、手動によるプロファイリングコードへの依存をどの程度軽減できるか?
- RQ3インタラクティブなデータサイエンスワークフローにおいて、ユーザーはライブプロファイルと静的プロファイルのどちらの使いやすさと価値をより高く評価するか?
- RQ4自動化されたデータプロファイリングツールは、データ品質の問題を偶然に発見するのを支援できるか?
- RQ5コードエクスポート機能は、後続の分析とドキュメンテーションを支援するためにどの程度効果的か?
主な発見
- スタディー中、ユーザーが生成したインサイトの91%が、手動で書かれたプロファイリングコードではなく、AutoProfilerツールから生じた。
- ライブ版を利用した参加者たちは、データ変換の確認にリアルタイムでの更新が直感的で役立つと感じた。
- オンデマンド(非ライブ)版を利用したユーザーは、過去のビジュアライゼーションを確認し、データ状態を比較できる点を評価した。
- 縦断的ケーススタディから、継続的プロファイリングにより、ドメイン科学者が平坦な分布や異常値といった予期しないデータ品質の問題を、自動的かつ継続的なビジュアライゼーションを通じて発見できたことが明らかになった。
- コードエクスポート機能は非常に評価されており、ユーザーがコードをゼロから書くことなく、すぐに視覚化をカスタマイズ・拡張できるようになった。
- ライブ版とオンデマンド版の両方のAutoProfilerは、EDAに要する作業負荷を顕著に軽減するとともに、微細なデータ品質の問題を検出する可能性を高めた。
より良い研究を、今すぐ始めましょう
論文の読解から最終レビューまで、研究時間を劇的に削減しましょう。
クレジットカード登録不要
このレビューはAIが作成し、人間の編集者が確認しました。