
[論文レビュー] Quantifying Prediction Consistency Under Fine-Tuning Multiplicity in Tabular LLMs
本稿では、再訓練を伴わずに、微調整されたテーブル型言語モデルにおける予測のロバスト性を定量化するための新しい一貫性指標を提案する。埋め込み空間内の局所的近傍をサンプリングし、ベルシュタインの不等式を活用することで、高い一貫性を持つ予測が微調整バリアント間で安定している確率的保証を提供する。この手法は、予測の多様性への感受性を予測するのにも、信頼度スコアを上回る性能を示す。
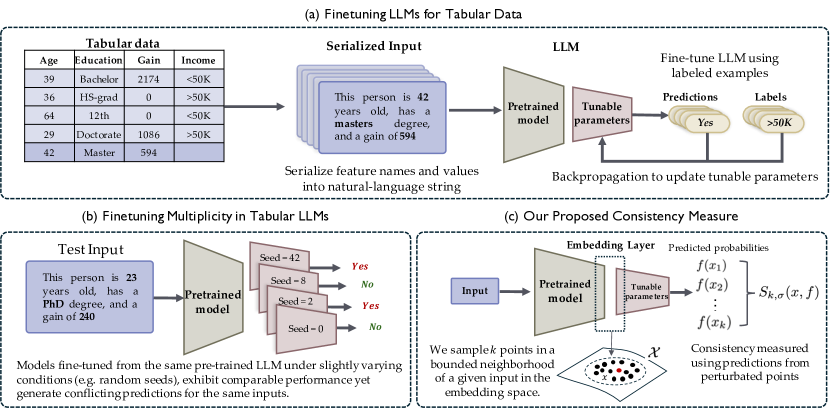
Fine-tuning LLMs on tabular classification tasks can lead to the phenomenon of fine-tuning multiplicity where equally well-performing models make conflicting predictions on the same input. Fine-tuning multiplicity can arise due to variations in the training process, e.g., seed, weight initialization, minor changes to training data, etc., raising concerns about the reliability of Tabular LLMs in high-stakes applications such as finance, hiring, education, healthcare. Our work formalizes this unique challenge of fine-tuning multiplicity in Tabular LLMs and proposes a novel measure to quantify the consistency of individual predictions without expensive model retraining. Our measure quantifies a prediction's consistency by analyzing (sampling) the model's local behavior around that input in the embedding space. Interestingly, we show that sampling in the local neighborhood can be leveraged to provide probabilistic guarantees on prediction consistency under a broad class of fine-tuned models, i.e., inputs with sufficiently high local stability (as defined by our measure) also remain consistent across several fine-tuned models with high probability. We perform experiments on multiple real-world datasets to show that our local stability measure preemptively captures consistency under actual multiplicity across several fine-tuned models, outperforming competing measures.
研究の動機と目的
- 微調整における多様性を形式化すること。同程度の精度を持つモデルが、トレーニングのばらつきにより異なる予測を出力する現象を対象とする。
- 大規模言語モデルにおける多様性を評価するために複数回の再訓練を行う不切実な状況を解消すること。
- 再訓練を伴わず、計算効率の良い指標を構築し、予測のロバスト性を定量化すること。
- 微調整されたモデルバリアント間での予測一貫性について、理論的な確率的保証を提供すること。
提案手法
- 入力の埋め込み空間における局所的モデル挙動を評価する一貫性指標 $ S_{k, ho}(x,f) = \frac{1}{k}\sum_{x_i \in N_{x,k}} \left( f(x_i) - |f(x) - f(x_i)| \right) $ を提案する。
- モデルの埋め込み空間を用いて、入力 $ x $ を中心とする半径 $ \sigma $ の超球から $ k $ 個の点をサンプリングする。
- ベルシュタインの不等式を用いて、確率的ロバスト性保証を導出する。高い一貫性は、微調整されたモデル間で予測が安定する確率が高くなることを示す。
- 実際のテーブルデータセットを用いて、標準的な多様性指標(例:恣意性、ペアワイズ不一致)と一貫性を実証的に比較評価する。
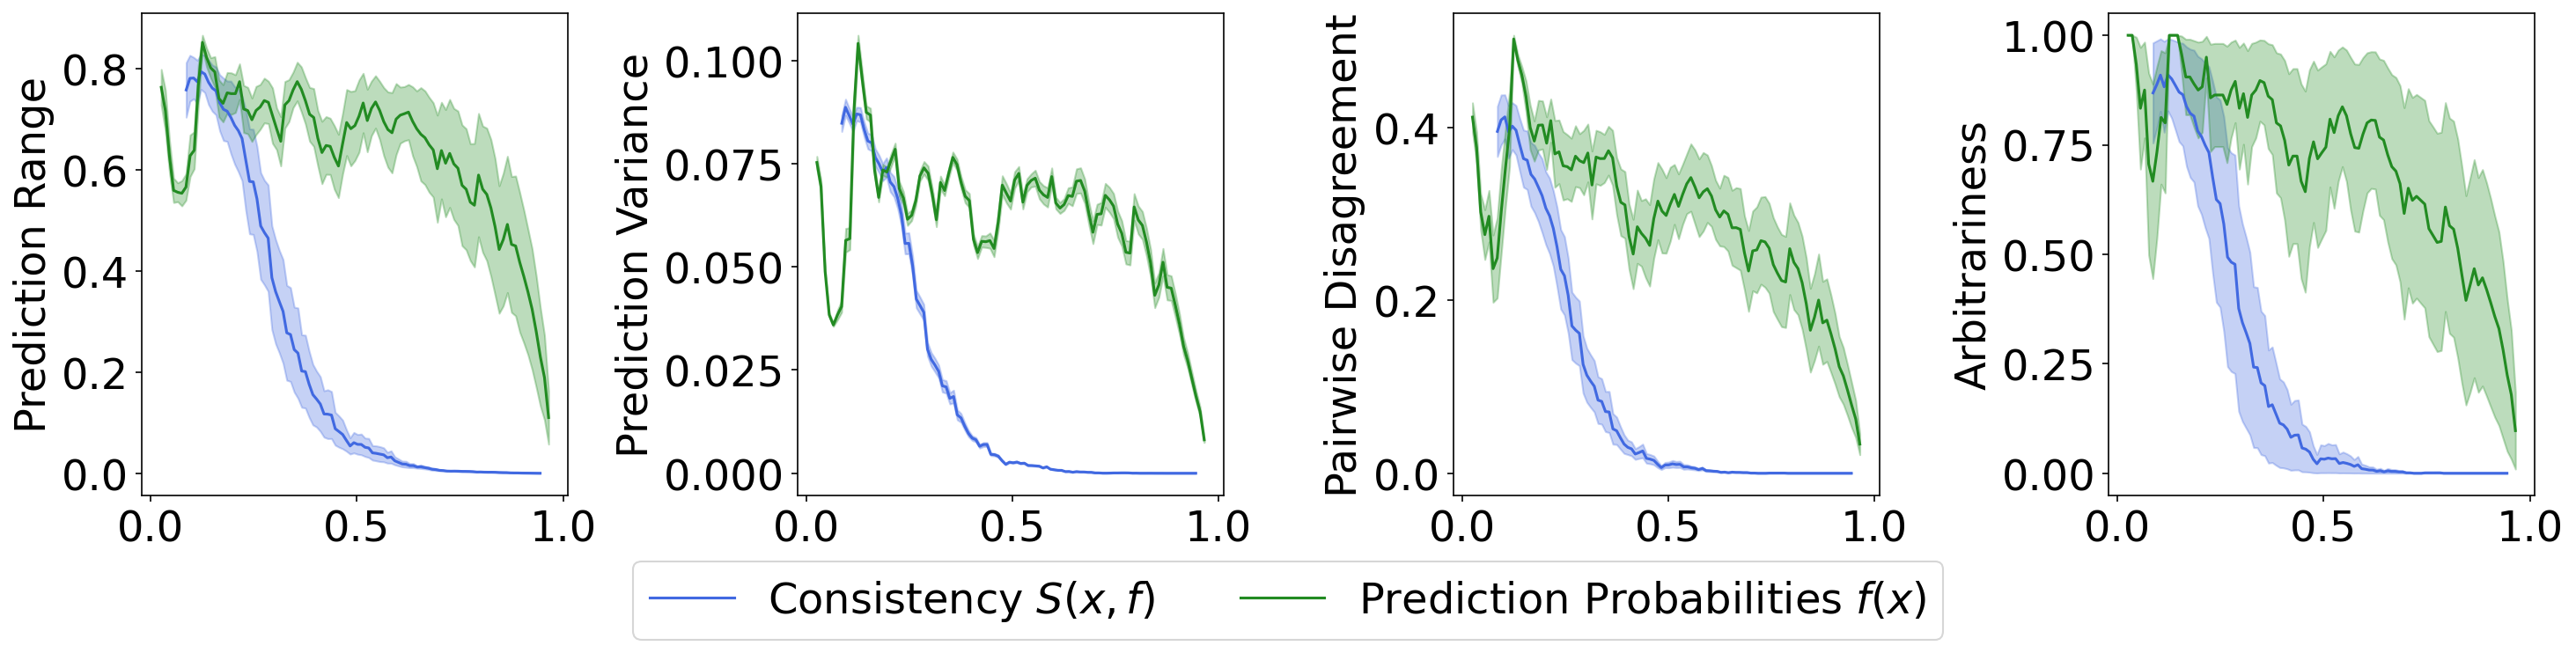
- 一貫性スコアと予測確率を比較し、多様性感受性の識別において一貫性が優れていることを示す。
- 128ショット、64ショット、512ショットの設定において、Adult、German Credit、Diabetes データセットで本手法を検証する。
実験結果
リサーチクエスチョン
- RQ1微調整されたテーブル型言語モデルは、類似した性能を示すにもかかわらず、予測の多様性をどの程度示すのか?
- RQ21つのモデルが埋め込み空間における局所的挙動を示すことで、微調整多様性に対する感受性を信頼性を持って予測できるか?
- RQ3提案された一貫性指標は、予測の信頼度と比較して、多様性を示しやすい予測を特定する上で優れているか?
- RQ4微調整のばらつきに対して、予測一貫性について理論的な確率的保証を導出できるか?
- RQ5一貫性指標は実際の現場で、再訓練の必要を減らし、信頼度スコアよりも情報量が多く、計算的に実行可能か?
主な発見
- 一貫性指標は、ペアワイズ不一致などの多様性指標と強いスピアマン相関(最大 0.96)を示し、予測確率を著しく上回る性能を示した。
- Adult データセットでは、一貫性が恣意性と 0.80 の相関を示したが、予測信頼度は 0.67 にとどまった。
- 高い予測信頼度であっても、多様性が低いとは限らない。一部の高信頼度予測では、微調整されたモデル間で著しい不一致が観察された。
- Diabetes データセットでは、一貫性が予測範囲と 0.95 の相関を示し、多様性の深刻さと強く整合していることがわかった。
- ベルシュタインの不等式による理論的保証により、高い一貫性を持つ予測は、微調整されたバリアント間で安定している可能性が極めて高いことが確認された。
- 本手法により、1つのモデルと局所的近傍の推論のみで多様性の評価が可能になり、高価な再訓練の必要が大幅に削減された。
より良い研究を、今すぐ始めましょう
論文の読解から最終レビューまで、研究時間を劇的に削減しましょう。
クレジットカード登録不要
このレビューはAIが作成し、人間の編集者が確認しました。