
[論文レビュー] SpaceNet 6: Multi-Sensor All Weather Mapping Dataset
本論文は、120 km²の高分解能(1m未塔のGSD)SARおよび光学画像を含む、48,000個のアノテート済み建物の敷地を有する、SpaceNet 6 Multi-Sensor All Weather Mapping(MSAW)データセットを紹介する。SAR画像のみで学習する場合(F₁ = 0.135)と比較して、光学データでの事前学習を用いたトランスファー学習により、SARベースの建物敷地セグメンテーション性能が著しく向上(F₁ = 0.21)することを示しており、あらゆる天候下での地理空間解析におけるマルチモーダルデータの価値を強調している。
Within the remote sensing domain, a diverse set of acquisition modalities exist, each with their own unique strengths and weaknesses. Yet, most of the current literature and open datasets only deal with electro-optical (optical) data for different detection and segmentation tasks at high spatial resolutions. optical data is often the preferred choice for geospatial applications, but requires clear skies and little cloud cover to work well. Conversely, Synthetic Aperture Radar (SAR) sensors have the unique capability to penetrate clouds and collect during all weather, day and night conditions. Consequently, SAR data are particularly valuable in the quest to aid disaster response, when weather and cloud cover can obstruct traditional optical sensors. Despite all of these advantages, there is little open data available to researchers to explore the effectiveness of SAR for such applications, particularly at very-high spatial resolutions, i.e. <1m Ground Sample Distance (GSD). To address this problem, we present an open Multi-Sensor All Weather Mapping (MSAW) dataset and challenge, which features two collection modalities (both SAR and optical). The dataset and challenge focus on mapping and building footprint extraction using a combination of these data sources. MSAW covers 120 km^2 over multiple overlapping collects and is annotated with over 48,000 unique building footprints labels, enabling the creation and evaluation of mapping algorithms for multi-modal data. We present a baseline and benchmark for building footprint extraction with SAR data and find that state-of-the-art segmentation models pre-trained on optical data, and then trained on SAR (F1 score of 0.21) outperform those trained on SAR data alone (F1 score of 0.135).
研究の動機と目的
- マルチモーダル地理空間解析のためのオープンで高分解能なSARおよび光学データセットの不足に対処すること。
- 合成開口レーダ(SAR)および光学データを用いた、あらゆる天候下での建物敷地抽出に関する研究を可能にすること。
- 現実世界の上空撮影条件下で困難な状況にあるマルチモーダルセグメンテーションモデルの評価のためのベンチマークを提供すること。
- 継続的な曇りがちな天候下でも耐障害的なマッピングが可能となるように、災害対応研究を支援すること。
提案手法
- MSAWデータセットは、複数の場所で収集された120 km²の重複するSARおよび光学衛星画像を含む。
- 建物の敷地は、高精度なLiDAR由来の高さ推定値を用いてアノテートされ、幾何的整合性とオブジェクトレベルのラベル付けが保証された。
- ベースラインのセマンティックセグメンテーションモデルは、トランスファー学習を用いて訓練された:光学データでの事前学習の後、SARデータでのファインチューニングを実施。
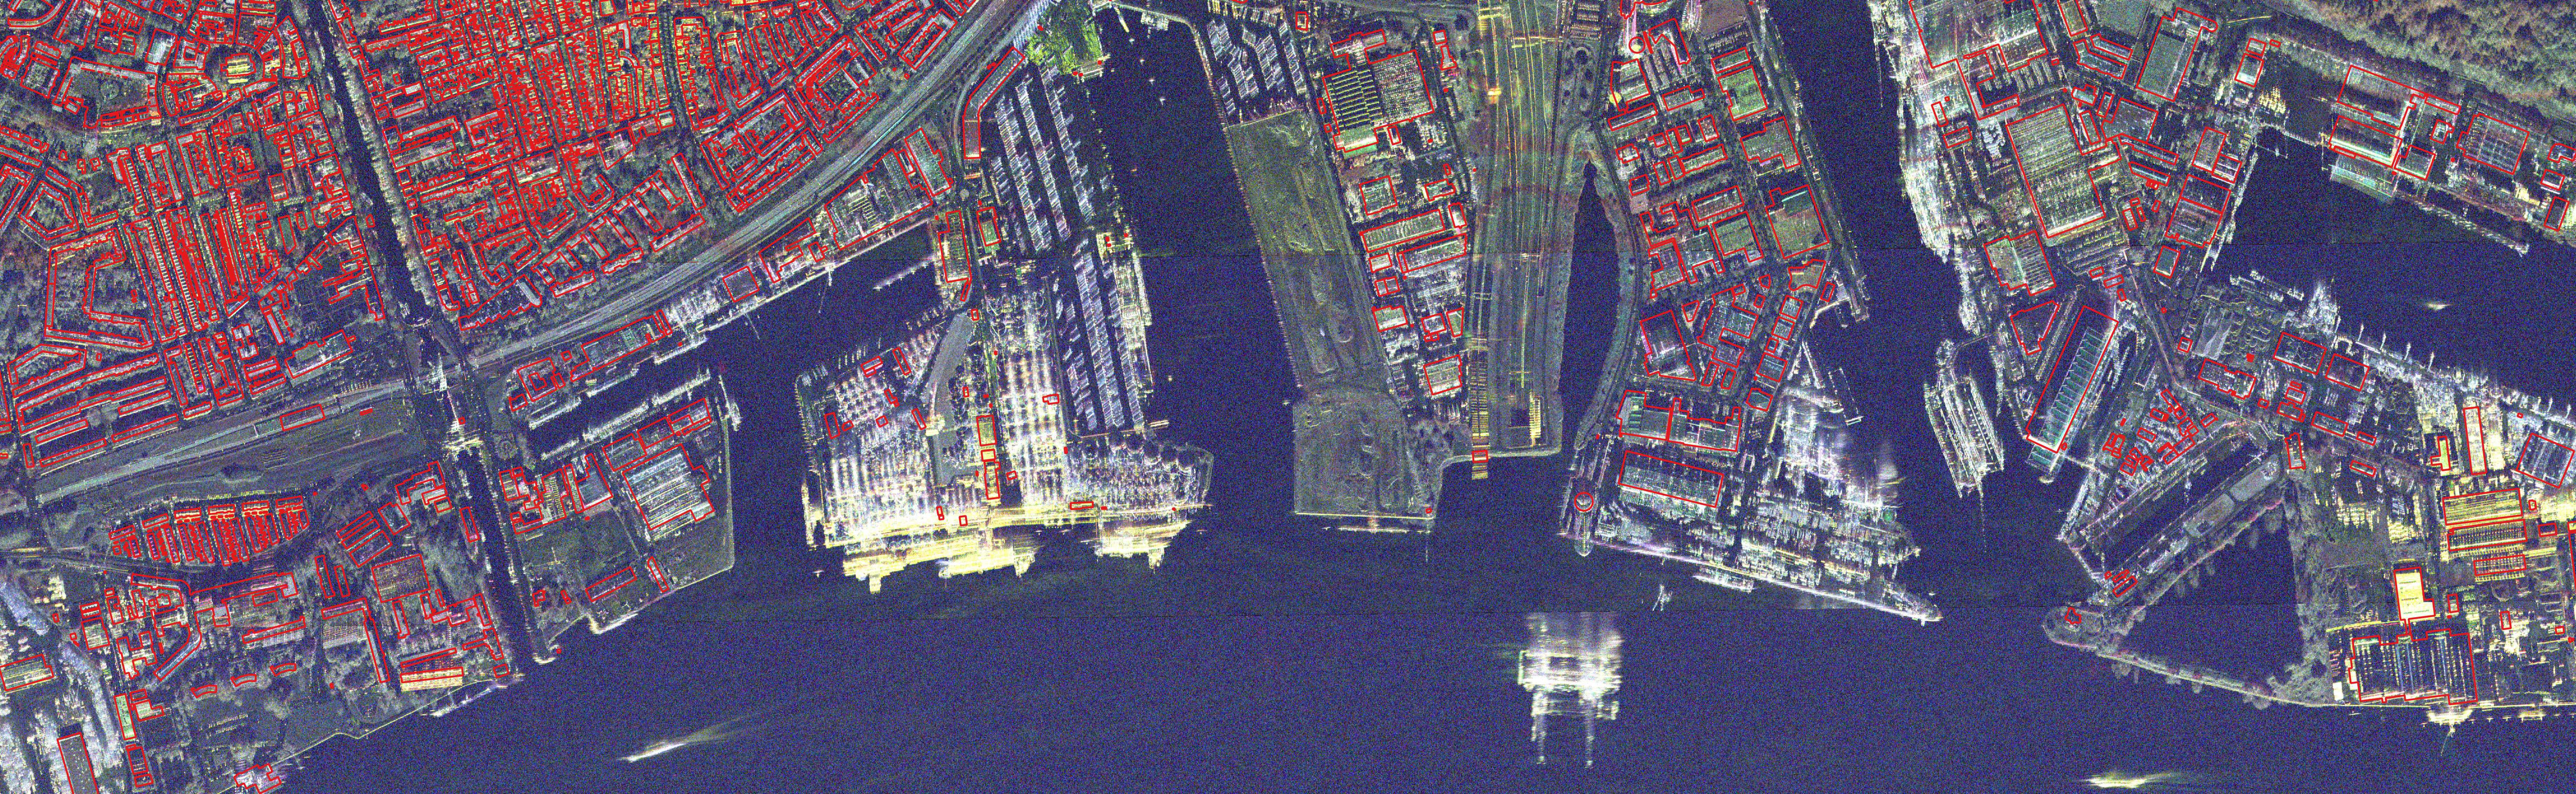
- SAR画像には3つの偏波(HH、VV、HV)が含まれており、特徴の可視化を向上させるためにRGBコンポジットとして可視化されている。
- 性能評価にはF₁スコア、IoU、再現率が用いられ、建物のサイズおよび高さごとに層別分析が実施された。
- 建物の性質(面積、高さ、体積)がセグメンテーションIoUスコアに与える予測力の評価には、ランダムフォレストモデルが使用された。
実験結果
リサーチクエスチョン
- RQ1光学データからのトランスファー学習が、高分解能SAR画像における建物敷地セグメンテーション性能を顕著に向上させることができるか?
- RQ2建物のサイズおよび高さは、SAR画像内での構造物の検出可能性にどのように影響するか?
- RQ3ラップアラウンドや前方歪みのような幾何的歪みが、より高い建物のセグメンテーション性能をどの程度劣化させるか?
- RQ4建物の性質(例:面積、高さ、体積)は、SARデータにおけるセグメンテーションモデルの性能(IoU)をどの程度予測できるか?
- RQ5SARのみ(単一モodal)とSAR+光学(マルチモーダル)の両方で学習した場合の、建物敷地抽出における性能差はどの程度か?
主な発見
- 光学データでの事前学習をSARデータに適用したトランスファー学習により、F₁スコアが0.21に達し、SARデータでの学習のみの場合(F₁ = 0.135)と比較して55%の向上を達成した。
- 建物敷地検出の再現率は、約100 m²で0.1に低下し、SAR画像内では小規模な建物はほぼ検出不能であることが示された。
- 大きな建物では再現率が0.5でプラトーに達するが、20メートルを超える高さの建物では、ラップアラウンドなどの幾何的歪みのため性能が低下する。
- 平均面積が1,400 m²と非常に広いにもかかわらず、30メートルを超える高さの建物では平均再現率が0.2未満にとどまり、レーダ固有の歪みの影響が顕著であることが明らかになった。
- 建物の高さは、セグメンテーションIoUの予測に最も強い特徴(重要度 = 0.39)であり、これは面積や歪み効果と強い相関があるため、ベースラインモデルでは明示的に使用されていなくても顕著である。
- ランダムフォレストモデルは、建物の性質からIoUを予測する際にR² = 0.91を達成し、サイズと高さがセグメンテーションの難易度を強く示す指標であることを確認した。
より良い研究を、今すぐ始めましょう
論文の読解から最終レビューまで、研究時間を劇的に削減しましょう。
クレジットカード登録不要
このレビューはAIが作成し、人間の編集者が確認しました。