
[Paper Review] Exploring Progress in Multivariate Time Series Forecasting: Comprehensive Benchmarking and Heterogeneity Analysis
This paper introduces BasicTS, a fair benchmark for multivariate time series forecasting that standardizes training and evaluation to resolve inconsistencies in model comparisons. It reveals that model performance disparities stem from data heterogeneity, not model superiority, and provides a roadmap for selecting or designing models based on temporal and spatial characteristics of datasets.
Multivariate Time Series (MTS) analysis is crucial to understanding and managing complex systems, such as traffic and energy systems, and a variety of approaches to MTS forecasting have been proposed recently. However, we often observe inconsistent or seemingly contradictory performance findings across different studies. This hinders our understanding of the merits of different approaches and slows down progress. We address the need for means of assessing MTS forecasting proposals reliably and fairly, in turn enabling better exploitation of MTS as seen in different applications. Specifically, we first propose BasicTS+, a benchmark designed to enable fair, comprehensive, and reproducible comparison of MTS forecasting solutions. BasicTS+ establishes a unified training pipeline and reasonable settings, enabling an unbiased evaluation. Second, we identify the heterogeneity across different MTS as an important consideration and enable classification of MTS based on their temporal and spatial characteristics. Disregarding this heterogeneity is a prime reason for difficulties in selecting the most promising technical directions. Third, we apply BasicTS+ along with rich datasets to assess the capabilities of more than 45 MTS forecasting solutions. This provides readers with an overall picture of the cutting-edge research on MTS forecasting. The code can be accessed at https://github.com/GestaltCogTeam/BasicTS.
Motivation & Objective
- Address the lack of fair and consistent benchmarking in multivariate time series forecasting (MTS), which leads to unreliable performance comparisons across studies.
- Systematically analyze the heterogeneity of MTS datasets across temporal and spatial dimensions to explain why prior conclusions about model performance are often misleading.
- Provide a comprehensive, reproducible comparison of over 30 MTS forecasting models across 18+ datasets using the proposed BasicTS benchmark.
- Develop a practical road map for model selection and design based on data characteristics, emphasizing efficiency and robustness over model complexity.
- Highlight that simpler models like LTSF-Linear and STID often outperform complex architectures, suggesting that future research should prioritize distribution drift modeling and uncertainty estimation.
Proposed method
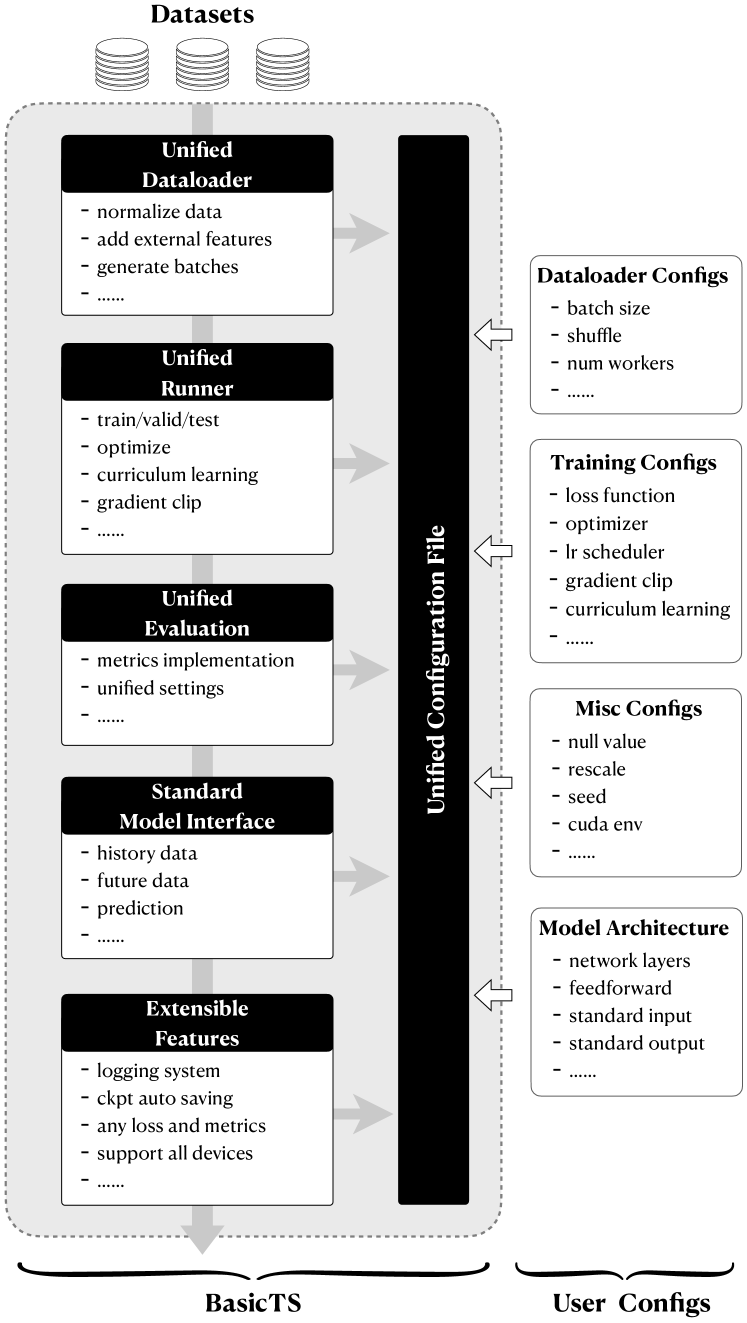
- Propose BasicTS, a unified training and evaluation pipeline that standardizes data preprocessing, model training, and evaluation metrics to ensure fair comparisons across models.
- Classify MTS datasets based on temporal patterns—clear/stable, significant distribution drift, or unclear patterns—using statistical and visualization analysis.
- Quantify spatial dependencies using a novel spatial dependency metric to distinguish datasets with and without significant spatial indistinguishability.
- Conduct a large-scale, reproducible benchmarking of 30+ MTS models on 18+ real-world datasets, evaluating both performance (MAE, MSE, MAPE, WAPE) and efficiency (inference speed, FLOPs).
- Integrate graph-based, latent-graph, and non-graph methods into a unified evaluation framework to assess the impact of spatial modeling on prediction accuracy.
- Propose a model selection road map based on data characteristics: temporal pattern stability and spatial dependency strength, recommending simple models as strong baselines.
Experimental results
Research questions
- RQ1To what extent do inconsistent benchmarking practices lead to unreliable performance comparisons across MTS forecasting models?
- RQ2How do temporal and spatial heterogeneities in MTS datasets affect the generalizability of model performance claims in prior research?
- RQ3Which model architectures consistently outperform others across diverse MTS datasets when evaluated under fair and standardized conditions?
- RQ4Can simpler models like LTSF-Linear or STID serve as strong baselines that outperform more complex models in real-world settings?
- RQ5What are the key design principles for selecting or developing MTS forecasting models based on data-specific characteristics?
Key findings
- The performance of widely used models like DCRNN and GWNet is often underestimated in recent studies due to inconsistent benchmarking, with reported performance drops of up to 33%.
- Normalization-based evaluation using MAE and MSE on normalized data leads to deceptively low error scores; using re-normalized data with MAPE and WAPE yields more reliable and realistic performance assessment.
- Models such as Graph WaveNet and MTGNN, published in 2019 and 2020, still outperform many newer models like StemGNN and GTS on standard benchmarks, indicating limited gains from model complexity.
- STID and STNorm achieve high efficiency and strong performance across most datasets, suggesting that model efficiency and simplicity are often more valuable than architectural complexity.
- Learning effective graph structures is challenging; only MTGNN and STEP successfully learn useful graphs without degrading performance, while most other methods fail to improve over fixed or learned baselines.
- The majority of recent model improvements stem from architectural complexity rather than meaningful gains in predictive accuracy, especially on datasets with distribution drift or unclear patterns.
Better researchstarts right now
From reading papers to final review, dramatically reduce your research time.
No credit card · Free plan available
This review was created by AI and reviewed by human editors.