
[Paper Review] Measuring Conflict in a Multi-Source Environment as a Normal Measure
This paper proposes a novel conflict measure (CF) for multi-source interval-valued data using a normal measure framework to quantify inconsistency among sources without relying on external credibility knowledge. The method computes conflict as a weighted sum over sub-intervals of the global range, where unmet coverage by sources increases the conflict score; results show the measure aligns with human intuition and effectively identifies conflicting sources in simulated and real sensor data.
In a multi-source environment, each source has its own credibility. If there is no external knowledge about credibility then we can use the information provided by the sources to assess their credibility. In this paper, we propose a way to measure conflict in a multi-source environment as a normal measure. We examine our algorithm using three simulated examples of increasing conflict and one experimental example. The results demonstrate that the proposed measure can represent conflict in a meaningful way similar to what a human might expect and from it we can identify conflict within our sources.
Motivation & Objective
- To develop a conflict measurement method for multi-source environments where source credibility is unknown and must be inferred from data alone.
- To create a conflict measure that aligns with human expectations of inconsistency in source outputs.
- To enable identification of conflicting sources through a quantifiable, scalable metric applicable to interval-valued evidence.
- To provide a foundation for future work on formal conflict detection and extension to set-valued information.
Proposed method
- The conflict measure (CF) is defined as a normal measure (NM) over source combinations, ensuring monotonicity and avoiding counterintuitive decreases when adding sources.
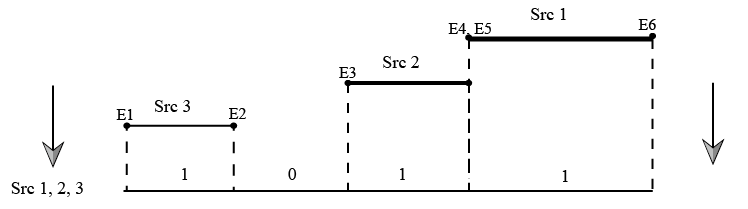
- The method partitions the global measurement range into sub-intervals based on all source interval endpoints, creating a set of non-overlapping intervals $\overline{P}_k$.
- For each sub-interval $\overline{P}_k$, the algorithm computes a conflict weight based on the fraction of sources in a given tuple $A'$ that do not cover $\overline{P}_k$, scaled by the interval length.
- The core formula $\tilde{g}^{CF}(A') = \sum_{k=1}^{2n-1} \Phi(\overline{P}_k, A') \cdot |\overline{P}_k| \cdot \left(\frac{i - O(\overline{P}_k)}{i}\right)$ computes the total conflict for a source tuple $A'$ of size $i$.
- The final normalized conflict $g^{CF}(A')$ is obtained by dividing the raw conflict sum by the total range of the tuple, ensuring scale invariance.
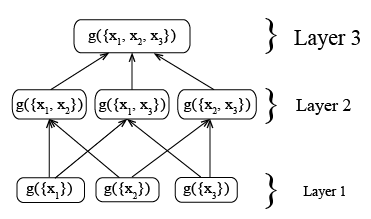
- The method uses a lattice structure to compute CF values across all source combinations, enabling comparison and conflict source identification.
Experimental results
Research questions
- RQ1Can a conflict measure be constructed that reflects human intuition about inconsistency in multi-source interval data?
- RQ2How can conflict be quantified without relying on external credibility knowledge?
- RQ3Can the proposed measure consistently identify the most conflicting source in a set of interval-valued sources?
- RQ4Does the measure remain stable and meaningful when applied to real-world sensor data with dynamic outputs?
Key findings
- The proposed conflict measure (CF) produces values that align with human expectations of conflict, particularly in detecting inconsistent sources.
- In Example 1, the CF value for $\{x_1,x_2,x_4\}$ was higher than for $\{x_1,x_2,x_3\}$, correctly identifying source 4 as more conflicting due to less overlap with others.
- In Example 2, the CF correctly identified source 1 as the unique conflicting source, with $g^{CF}(\{x_1,x_4\}) > g^{CF}(\{x_1,x_3\})$ due to greater non-overlap.
- In Example 3, where all intervals were disjoint, CF values in the upper layers exceeded 0.5 and reached 0.8333, indicating extreme conflict.
- In the experimental example, $g^{CF}(\{x_1,x_2,x_3,x_4\})$ increased as sensor 1's temperature rose, indicating rising conflict, while $g^{CF}(\{x_2,x_3,x_4\})$ remained stable, identifying sensor 1 as the primary source of conflict.
- The largest difference in CF values occurred between the full set and the set excluding sensor 1, confirming sensor 1 as the most conflicting source in the experimental data.
Better researchstarts right now
From reading papers to final review, dramatically reduce your research time.
No credit card · Free plan available
This review was created by AI and reviewed by human editors.