
[논문 리뷰] MuSe-GNN: Learning Unified Gene Representation From Multimodal Biological Graph Data
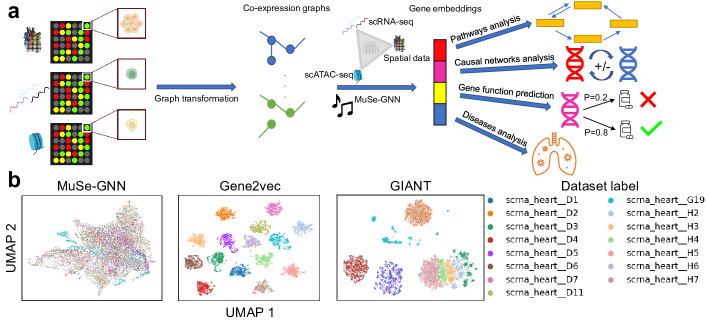
MuSe-GNN은 멀티모달 유전자 그래프 간 가중치를 공유하고 재구성, 가중 유사도, 대조 손실을 사용하여 데이터 세트 간 유전자 기능 유사성을 포착하는 통합된 유전자 임베딩을 학습합니다. 이는 조직과 모달리티 전반에서 기준선을 능가합니다.
Discovering genes with similar functions across diverse biomedical contexts poses a significant challenge in gene representation learning due to data heterogeneity. In this study, we resolve this problem by introducing a novel model called Multimodal Similarity Learning Graph Neural Network, which combines Multimodal Machine Learning and Deep Graph Neural Networks to learn gene representations from single-cell sequencing and spatial transcriptomic data. Leveraging 82 training datasets from 10 tissues, three sequencing techniques, and three species, we create informative graph structures for model training and gene representations generation, while incorporating regularization with weighted similarity learning and contrastive learning to learn cross-data gene-gene relationships. This novel design ensures that we can offer gene representations containing functional similarity across different contexts in a joint space. Comprehensive benchmarking analysis shows our model's capacity to effectively capture gene function similarity across multiple modalities, outperforming state-of-the-art methods in gene representation learning by up to 97.5%. Moreover, we employ bioinformatics tools in conjunction with gene representations to uncover pathway enrichment, regulation causal networks, and functions of disease-associated or dosage-sensitive genes. Therefore, our model efficiently produces unified gene representations for the analysis of gene functions, tissue functions, diseases, and species evolution.
연구 동기 및 목표
- 멀티모달 생물학 데이터의 데이터 이질성을 해결하여 조직, 서열 기법, 종에 걸친 통합된 유전자 표현을 학습한다.
- 여러 유전자 공동 발현 그래프를 하나의 임베딩 공간으로 통합하는 가중치 공유 GNN 프레임워크를 개발한다.
- 가중 유사도와 대조 학습으로 임베딩을 정규화하여 데이터 세트 간의 교차 데이터셋 유전자 기능 관계를 드러낸다.
- 경로 분석, 질병 연구, 유전자 기능 예측과 같은 다운스트림 작업에서 임베딩의 향상된 활용도를 시연한다.
제안 방법
- HVGs를 사용하고 노이즈-강건 처리(scTransform, CS-CORE, SPARK-X)로 각 데이터 세트에 대해 고분산 유전자 그래프를 구성한다.
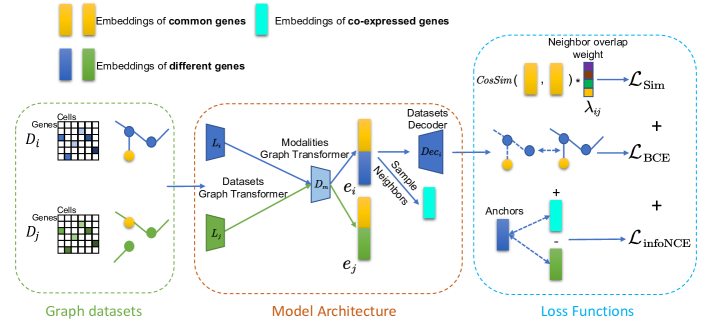
- 데이터 세트별 GT 계층과 공유 GT 계층을 가진 교차 그래프 트랜스포머를 사용하여 그래프 간 가중치 공유를 강제한다.
- 그래프 오토인코더 스타일로 공동 발현 네트워크를 재구성하기 위해 데이터 세트별 MLP 디코더로 노드 임베딩을 디코드한다.
- 다중 구성 손실로 학습한다: 그래프 재구성 BCE 손실, 공통 HVG 간 가중 코사인 유사도 손실, 교차 그래프 일관성을 위한 자체 지도 InfoNCE 대조 손실.
- 가중치 λc로 BCE, 가중 코사인 유사도, InfoNCE 손실을 결합하는 최종 목표를 사용한다.
- 조직 across tissues에서 여섯 가지 성능 지표와 함께 다수의 생물학 벤치마크로 평가한다.
실험 결과
연구 질문
- RQ1이질적인 멀티모달 생물 그래프로부터 기능 유사성을 데이터 세트 간에 보존하면서 통합된 유전자 임베딩 공간을 학습할 수 있는가?
- RQ2데이터 세트별 그래프 트랜스포머 간의 가중치 공유가 비공유 기준선보다 교차 데이터셋 유전자 군집화를 개선하는가?
- RQ3가중 유사도 및 대조 손실이 데이터 세트 간 알려진 유전자 기능 그룹과 경로의 회복을 개선하는가?
- RQ4학습된 임베딩이 조직과 질병에 걸친 유전자 기능 예측 및 경로 분석과 같은 다운스트림 작업을 향상시키는가?
주요 결과
- MuSe-GNN은 여섯 가지 평가 지표에서 조직 전반에 걸쳐 기준선을 능가하며 포괄적 평가에서 최대 97.5%의 개선을 달성했다.
- 심장과 폐에서 MuSe-GNN은 각각 두 번째로 우수한 방법 대비 20.1%, 97.5% 더 나은 성능을 보였다.
- MuSe-GNN의 임베딩은 멀티모달 데이터를 공동 임베딩 공간으로 통합하여 모달리티를 넘나드는 기능적 유전자 군집을 드러낸다.
- 임베딩에 대한 GOEA와 IPA 분석은 생물학적으로 의미 있는 경로, 인과 네트워크, 질병 연관성을 식별한다.
- MuSe-GNN 임베딩을 이용한 유전자 기능 예측은 Geneformer 및 원시 데이터와 같은 기준선보다 더 높은 정확도를 보인다.
더 나은 연구,지금 바로 시작하세요
논문 읽기부터 검토까지, 연구 시간을 획기적으로 줄여보세요.
카드 등록 없음 · 무료 플랜 제공
이 리뷰는 AI가 만들고, 인간 에디터가 검토했습니다.