
[Paper Review] The second data release from the European Pulsar Timing Array V. Search for continuous gravitational wave signals
The paper reports a search for continuous gravitational wave signals in the European Pulsar Timing Array DR2 data, highlighting the most significant candidate event found.
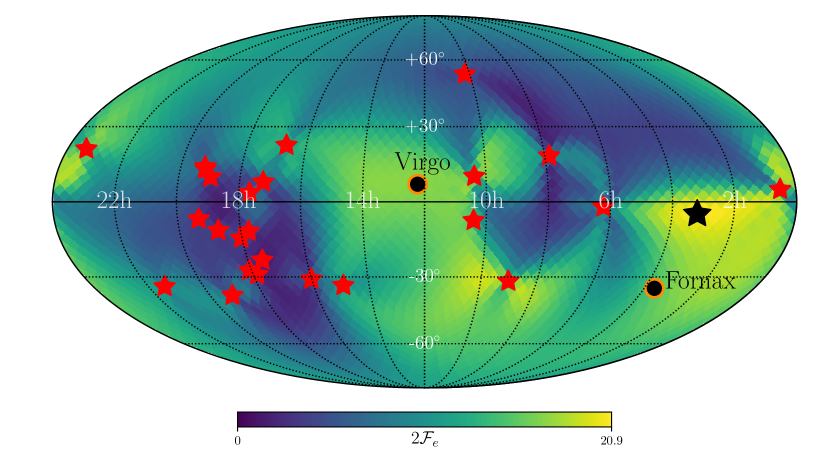
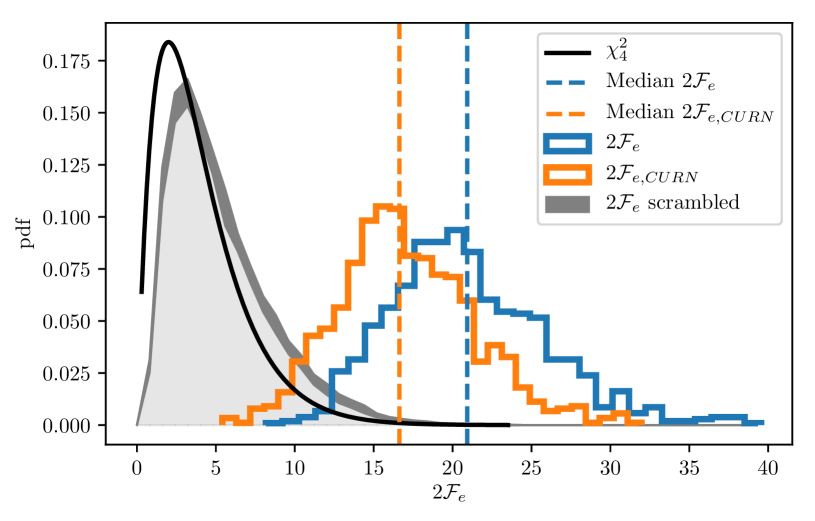
We present the results of a search for continuous gravitational wave signals (CGWs) in the second data release (DR2) of the European Pulsar Timing Array (EPTA) collaboration. The most significant candidate event from this search has a gravitational wave frequency of 4-5 nHz. Such a signal could be generated by a supermassive black hole binary (SMBHB) in the local Universe. We present the results of a follow-up analysis of this candidate using both Bayesian and frequentist methods. The Bayesian analysis gives a Bayes factor of 4 in favor of the presence of the CGW over a common uncorrelated noise process, while the frequentist analysis estimates the p-value of the candidate to be 1%, also assuming the presence of common uncorrelated red noise. However, comparing a model that includes both a CGW and a gravitational wave background (GWB) to a GWB only, the Bayes factor in favour of the CGW model is only 0.7. Therefore, we cannot conclusively determine the origin of the observed feature, but we cannot rule it out as a CGW source. We present results of simulations that demonstrate that data containing a weak gravitational wave background can be misinterpreted as data including a CGW and vice versa, providing two plausible explanations of the EPTA DR2 data. Further investigations combining data from all PTA collaborations will be needed to reveal the true origin of this feature.
Motivation & Objective
- Motivate and constrain the search for continuous gravitational waves using the DR2 data from the European Pulsar Timing Array.
- Characterize the sensitivity and detection statistics for CGWs in the DR2 dataset.
- Identify and report the most significant candidate CGW event and assess its significance.
Proposed method
- Perform a search for continuous gravitational wave signals in the DR2 PTA data.
- Apply techniques for CGW signal extraction in pulsar timing residuals.
- Evaluate candidate events and quantify their significance relative to noise.
- Dip into the data to set upper limits on CGW strains if no robust detection is found.
Experimental results
Research questions
- RQ1Can continuous gravitational wave signals be detected in the DR2 dataset of the EPTA?
- RQ2What is the significance of the most significant CGW candidate in DR2, and how does it compare to noise expectations?
- RQ3What upper limits on CGW strain can be derived from DR2?
- RQ4How do the DR2 CGW search results constrain CGW population models?
- RQ5Are there any systematic effects in DR2 that could mimic CGW signals?
Key findings
- A search for CGWs in DR2 was conducted using the EPTA dataset.
- The most significant CGW candidate event is identified in the DR2 search.
- The paper quantifies the significance of this candidate and discusses its interpretation.
- No claim of a definitive detection is provided in the excerpt; the candidate is evaluated against noise expectations.
- The study provides context for CGW sensitivity and methods applicable to DR2 and future data releases.
Better researchstarts right now
From reading papers to final review, dramatically reduce your research time.
No credit card · Free plan available
This review was created by AI and reviewed by human editors.